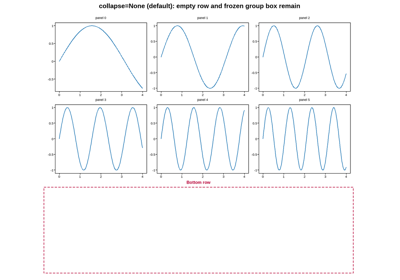
Figure layout

Assembling and manipulating the figure itself, rather than any one axes: sizing and DPI, manual and automatic margins, multi-cell subplot spans, label alignment across a grid, figure-space text and legends, a multi-figure Report, and clearing/reusing a Figure.

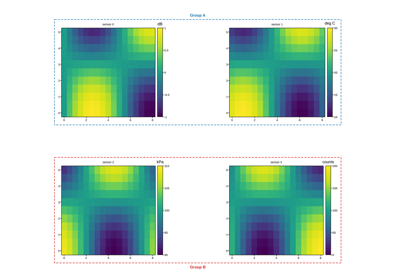
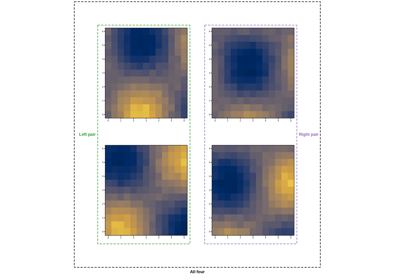
The Grouping axes section below covers fig.group() and the GroupLayout builder – drawing labeled boxes around clusters of related panels, and describing a whole grid of them declaratively instead of hand-slicing one big array.
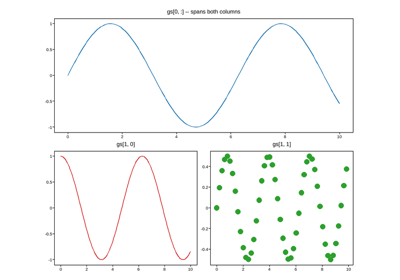
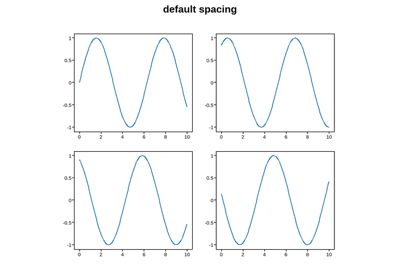
GridSpec row/column spans

GridSpec row/column spans

subplots_adjust

subplots_adjust

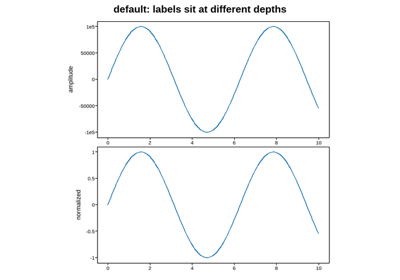
Aligning labels across a grid

Aligning labels across a grid

Figure-space text

Figure-space text

Resizing a figure after creation

Resizing a figure after creation

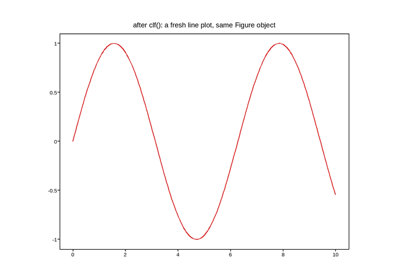
Clearing and reusing a figure

Clearing and reusing a figure

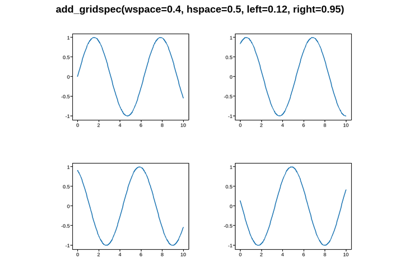
GridSpec margins

GridSpec margins

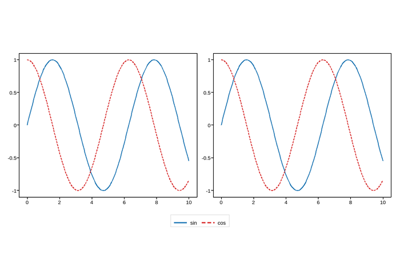
Figure-level legend

Figure-level legend

Combining figures into a Report

Combining figures into a Report

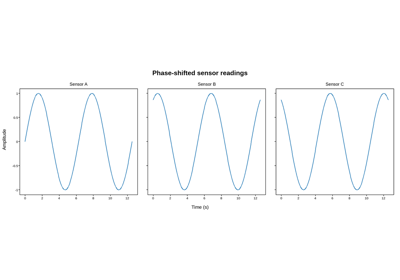
Figure title and shared axis labels

Figure title and shared axis labels

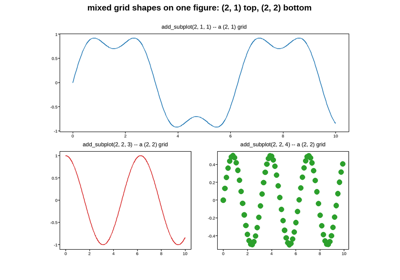
Mixed subplot grid shapes

Mixed subplot grid shapes

Orienting yourself in an unfamiliar figure

Orienting yourself in an unfamiliar figure

Drilling into one panel with ax.print_summary()

Drilling into one panel with ax.print_summary()

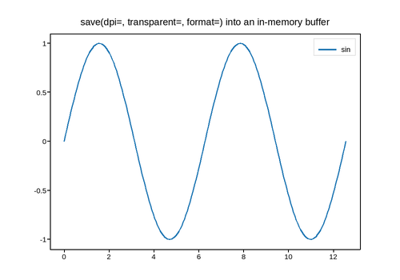
save(): dpi, transparent, format, and file-like targets
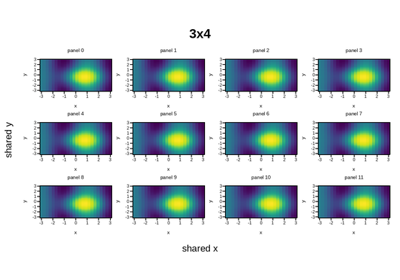
save(): dpi, transparent, format, and file-like targets

Sizing by the subplot, not the figure

Sizing by the subplot, not the figure

Grouping axes

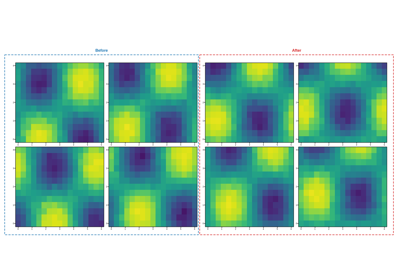
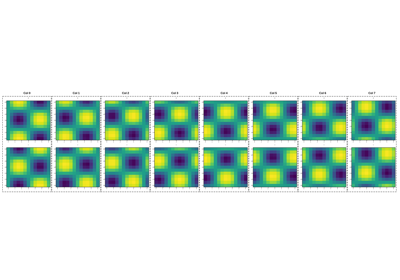
fig.group() draws a labeled box around a set of axes – a cluster of related panels in a larger grid, or a single one worth calling out – without a separate figure or a caption pointing back to it. The box clears each axes’ own tick labels, axis labels, and title, not just its bare plot rect; tight_layout() reserves margin for a group whose title faces the grid’s own outer edge, the same way it already does for a suptitle/colorbar/figure legend. fig.group_spacing() reserves extra room between subplots for group boxes at interior boundaries, where no title faces the boundary and nothing widens it automatically otherwise – without discarding tight_layout()’s own margins the way subplots_adjust() would.
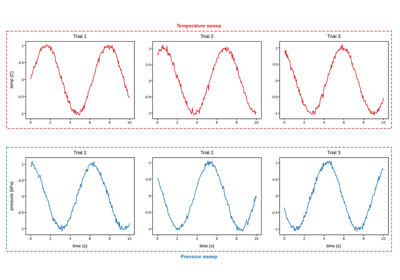
Grouping related axes

Grouping related axes

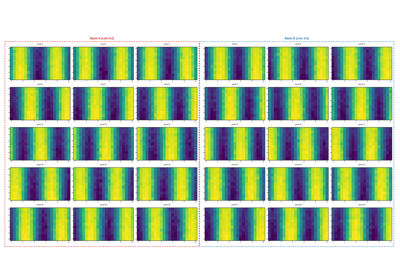
Grouping a large grid of panels

Grouping a large grid of panels

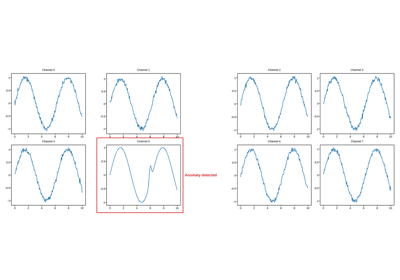
Highlighting one panel in a grid

Highlighting one panel in a grid

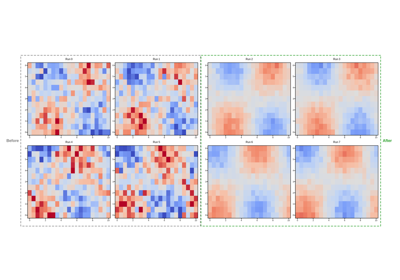
Side-by-side groups with left/right titles

Side-by-side groups with left/right titles

Many small groups: pairing every other row

Many small groups: pairing every other row

Many small groups: pairing adjacent columns

Many small groups: pairing adjacent columns

All four title positions at once

All four title positions at once

Group title fontsize, alongside a colorbar

Group title fontsize, alongside a colorbar

Colorbars stay inside the group box

Colorbars stay inside the group box

Nested groups

Nested groups

Unequal padding on each side of a group

Unequal padding on each side of a group

Many groups sharing one outer edge share one margin
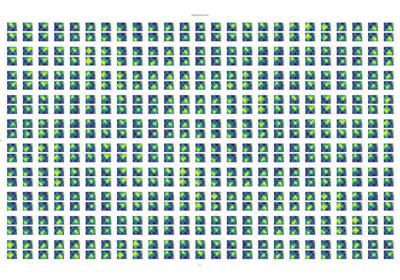
Many groups sharing one outer edge share one margin

500 panels, 250 groups, each with its own colorbar
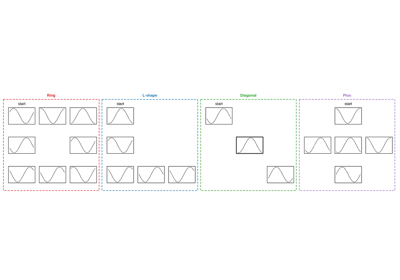
500 panels, 250 groups, each with its own colorbar
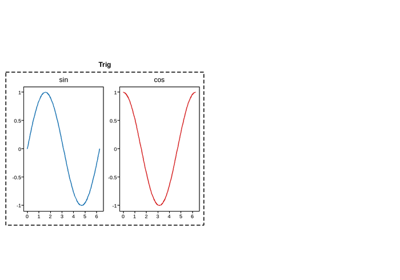
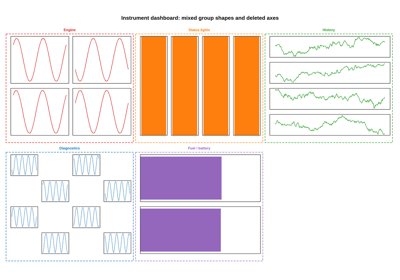
Irregular group shapes (deleted axes)

Irregular group shapes (deleted axes)

A dashboard mixing group shapes and deleted axes

A dashboard mixing group shapes and deleted axes

Mosaic titles, planning a layout ahead, and an ordinary grid’s own lookup
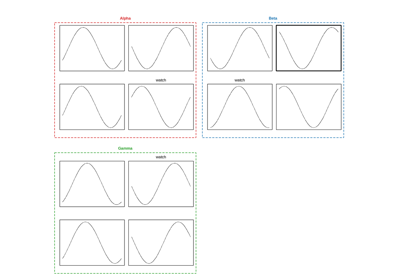
Mosaic titles, planning a layout ahead, and an ordinary grid's own lookup

Finding a group or axes again: title, id, or position
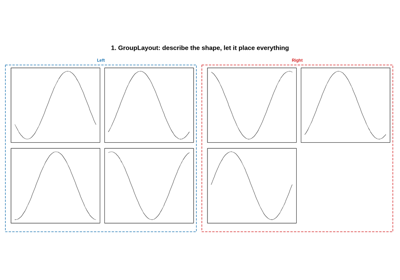
Finding a group or axes again: title, id, or position
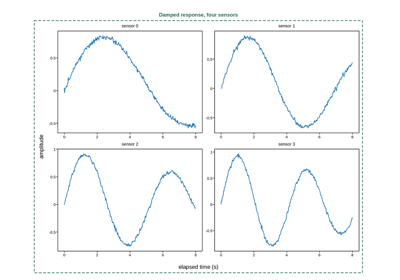
Two ways to build the same grouped figure

Two ways to build the same grouped figure

A group’s own shared x/y labels

A group's own shared x/y labels

Reclaiming whitespace after removing axes and groups

Reclaiming whitespace after removing axes and groups

Gallery generated by Sphinx-Gallery