Note
Go to the end to download the full example code.
Aligning labels across a grid
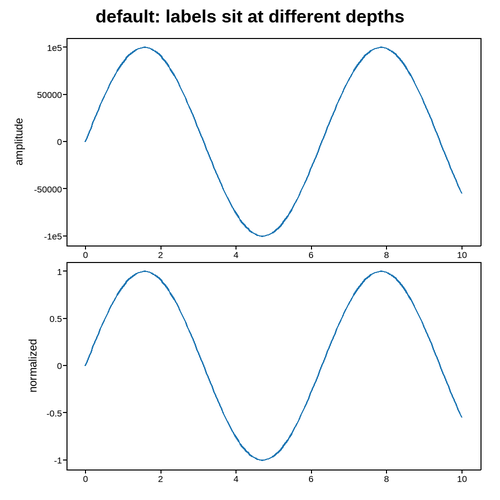
Stacked panels in the same column with different tick-label widths put their
y-axis label at different depths from the box by default. align_ylabels
(and align_xlabels/align_labels) line up every panel in that column
to the deepest position any of them needs, and stay aligned through a later
tight_layout. (Aligning is scoped to one column/row at a time, matching
matplotlib – panels in a different column have no shared depth to match.)
import numpy as np
import plotpress

x = np.linspace(0, 10, 200)


def _panels():
    fig, (top, bottom) = plotpress.subplots(2, 1, figsize=(5, 5))
    top.plot(x, np.sin(x) * 100000)   # wide tick labels push this y label out
    top.set_ylabel("amplitude")
    bottom.plot(x, np.sin(x))
    bottom.set_ylabel("normalized")
    return fig, top, bottom


fig, top, bottom = _panels()
fig.tight_layout()
fig.suptitle("default: labels sit at different depths")
Live figure — pick a tool, then zoom, pan, point-pick or annotate. Nothing is active until a tool is selected.
View this figure’s Vega export ↗ — the raw JSON spec, rendered live by a real Vega engine.
View this figure’s Vega-Lite export ↗ — the raw JSON spec(s), rendered live by a real Vega-Lite engine.
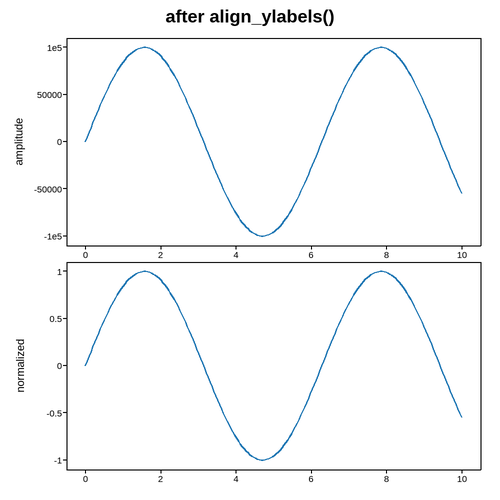
align_ylabels() moves both to the deepest position either one needs:
fig2, top2, bottom2 = _panels()
fig2.tight_layout()
fig2.align_ylabels()
fig2.suptitle("after align_ylabels()")
Live figure — pick a tool, then zoom, pan, point-pick or annotate. Nothing is active until a tool is selected.
View this figure’s Vega export ↗ — the raw JSON spec, rendered live by a real Vega engine.
View this figure’s Vega-Lite export ↗ — the raw JSON spec(s), rendered live by a real Vega-Lite engine.
Total running time of the script: (0 minutes 0.148 seconds)