Note
Go to the end to download the full example code.
GridSpec row/column spans
fig.add_gridspec(nrows, ncols) supports slicing for axes that cover more
than one cell – gs[0, :] spans the whole top row here, sized against the
two ordinary cells below it once tight_layout()
runs.
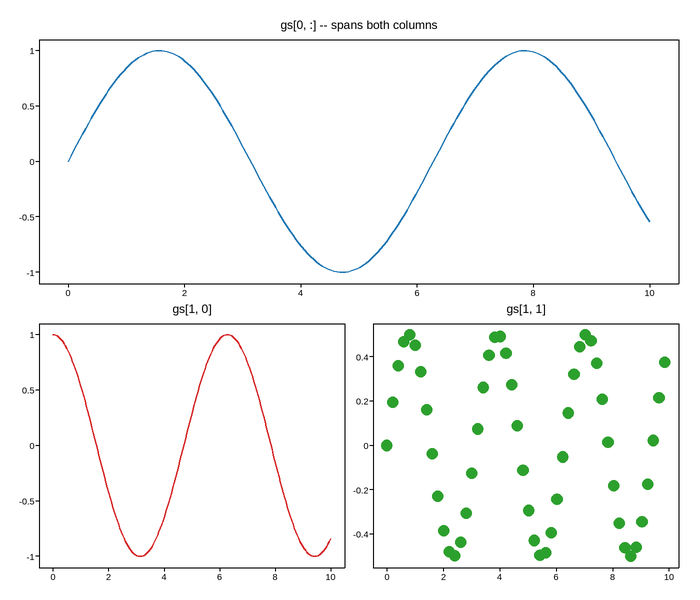
Live figure — pick a tool, then zoom, pan, point-pick or annotate. Nothing is active until a tool is selected.
View this figure’s Vega export ↗ — the raw JSON spec, rendered live by a real Vega engine.
View this figure’s Vega-Lite export ↗ — the raw JSON spec(s), rendered live by a real Vega-Lite engine.
import numpy as np
import plotpress

x = np.linspace(0, 10, 200)

fig = plotpress.Figure(figsize=(7, 6))
gs = fig.add_gridspec(2, 2)
top = fig.add_subplot(gs[0, :])
bottom_left = fig.add_subplot(gs[1, 0])
bottom_right = fig.add_subplot(gs[1, 1])

top.plot(x, np.sin(x), color="#1f77b4")
top.set_title("gs[0, :] -- spans both columns")
bottom_left.plot(x, np.cos(x), color="#d62728")
bottom_left.set_title("gs[1, 0]")
bottom_right.scatter(x[::4], np.sin(x[::4]) * np.cos(x[::4]), s=8, color="#2ca02c")
bottom_right.set_title("gs[1, 1]")
fig.tight_layout()
Total running time of the script: (0 minutes 0.075 seconds)