Note
Go to the end to download the full example code.
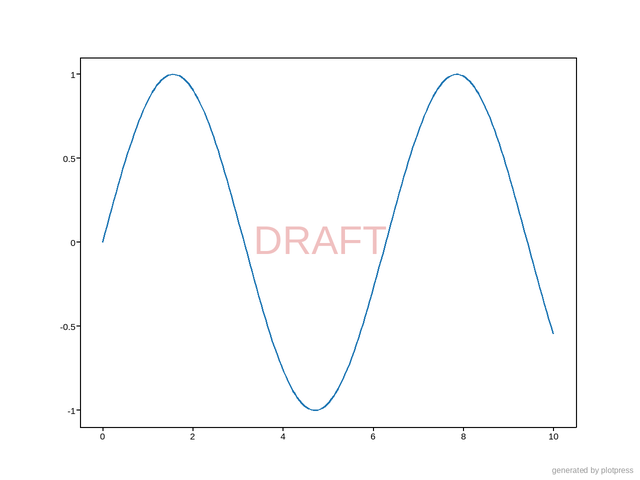
Figure-space text
fig.text(x, y, s) places text at figure-fraction coordinates – (0, 0)
bottom-left, (1, 1) top-right – independent of any axes’ data
coordinates. Handy for a watermark or a caption that shouldn’t move with the
plotted data.
Live figure — pick a tool, then zoom, pan, point-pick or annotate. Nothing is active until a tool is selected.
View this figure’s Vega export ↗ — the raw JSON spec, rendered live by a real Vega engine.
View this figure’s Vega-Lite export ↗ — the raw JSON spec(s), rendered live by a real Vega-Lite engine.
import numpy as np
import plotpress

x = np.linspace(0, 10, 200)

fig, ax = plotpress.subplots()
ax.plot(x, np.sin(x))
fig.text(0.99, 0.01, "generated by plotpress", ha="right", va="bottom",
         fontsize=8, color="#999999")
fig.text(0.5, 0.5, "DRAFT", ha="center", va="center", fontsize=40,
         color="#f0c0c0")
Total running time of the script: (0 minutes 0.084 seconds)