Large-scale figures
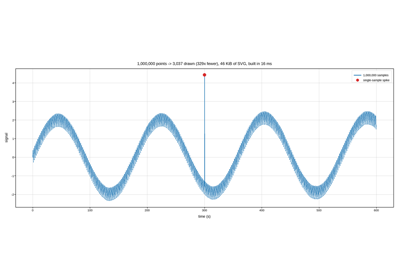
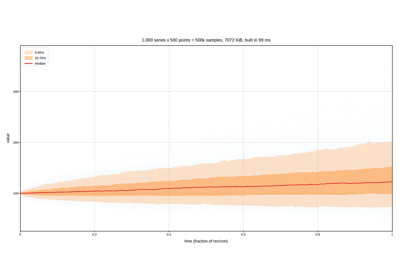
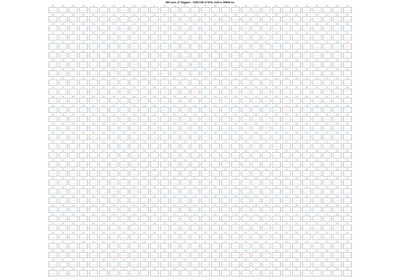
Figures big enough that build time and file size stop being incidental and become the design constraint: a million points in one line, millions of mesh cells, a thousand series on one axes, hundreds of axes on one canvas.
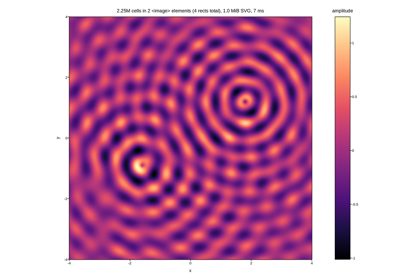
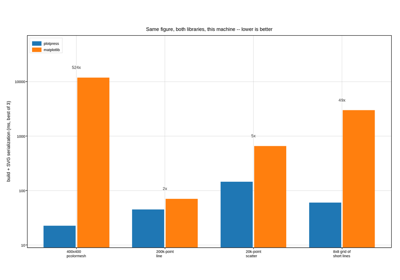
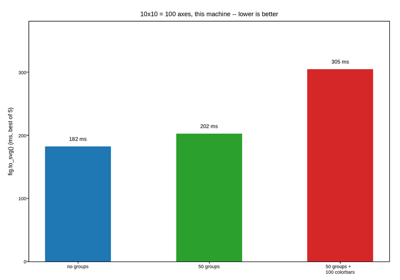
This is the case plotpress is built for, and the examples are arranged to show why rather than to assert it. Each one names the specific thing that would otherwise dominate – per-artist Python overhead, one SVG node per datum, a mesh emitted as a quarter of a million rectangles, pick data inlined at full precision – and says what the library does instead. Several are timed in the figure itself, and one runs the same workloads through matplotlib on the machine that built these docs and plots both.
The numbers are honest about their limits. They come from one machine, one Python, one run; they measure figure construction plus serialization, not interactive redraw; and matplotlib is doing more work than plotpress in several of them, because it is a far larger library with more to configure. Where plotpress is faster it is almost always for the same structural reason – fewer Python objects and fewer output nodes – and the comparison example says which cases those are.
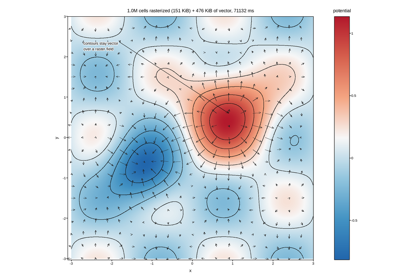
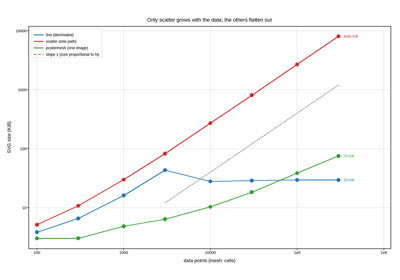
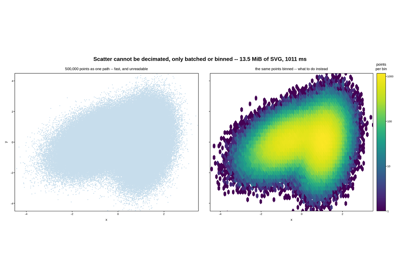
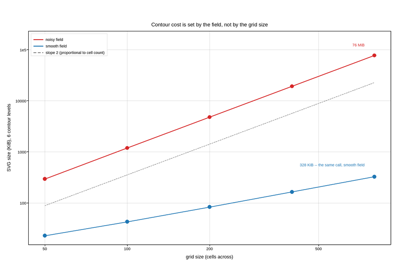
The same decisions have costs, and they are measured in the Where it runs out section at the foot of this page rather than left for you to discover: scatter output that grows with the data and never flattens, mesh cells that stop reaching the screen past one per pixel, the size of a self-contained interactive file, and contour output that has no ceiling at all.
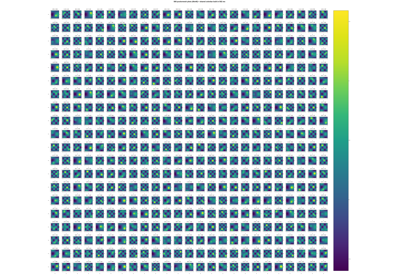
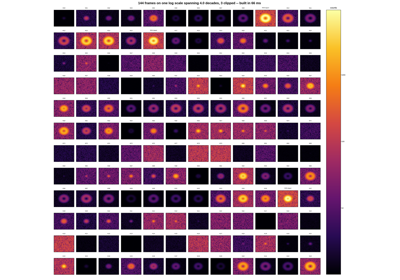
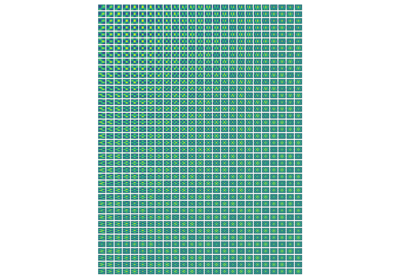
A 144-panel image grid under one logarithmic colorbar
Where it runs out
The examples above are the cases the design is good at. These are the ones it is not, and they are all consequences of the same two decisions that make the rest fast: a mesh becomes a fixed-resolution image, and everything else becomes vector nodes that are written out one per drawn thing.
None of these is a bug, and none has a workaround hiding in a keyword argument. They are the shape of the trade, measured: where a curve stops flattening, where extra data stops reaching the screen, and where the file grows faster than anything downstream can consume. The general limitations of the library – fonts, density estimates, projections – are documented separately in Limitations.
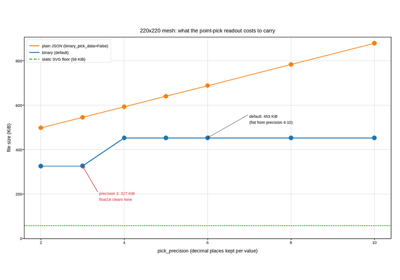
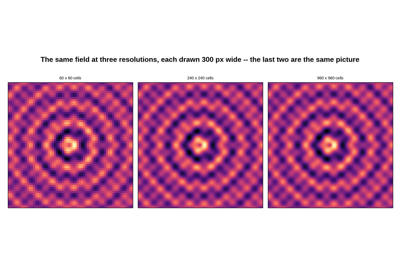
A mesh is an image, so cells past the pixel count are wasted
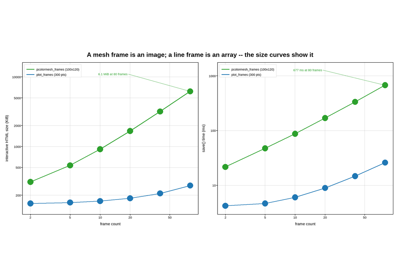
What an animated slider costs: size and save time against frame count