Note
Go to the end to download the full example code.
Does grouping axes slow anything down?
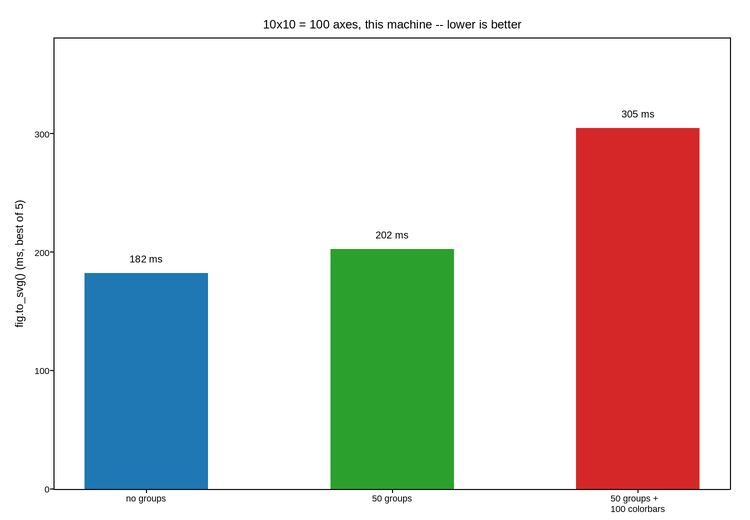
Short answer: not for how fig.group() is normally used. This times
fig.to_svg() on the same 10x10 grid three ways – no groups, 50 row-pair
groups, and those same 50 groups where every one of the 100 axes also carries
its own colorbar – to put a number on it rather than leave it to guesswork.
Wrapping a group’s box measures each grouped axes’ tick-label sizes (it already had to, to clear them – see the grouping gallery) and also looks for any colorbar belonging entirely to the group, so the box can wrap that too. That second lookup is the one place cost scales with how many groups there are: at 50 groups over 100 colorbar-carrying axes it adds a real, measurable amount – still tens of milliseconds, not something that would show up in a typical figure with a handful of groups.
Live figure — pick a tool, then zoom, pan, point-pick or annotate. Nothing is active until a tool is selected.
import time

import numpy as np
import plotpress

NROWS = NCOLS = 10


def best(fn, repeat=5):
    """Best-of-N wall time in milliseconds; the minimum is the least noisy."""
    out = float("inf")
    for _ in range(repeat):
        t0 = time.perf_counter()
        fn()
        out = min(out, (time.perf_counter() - t0) * 1e3)
    return out


def _build(add_groups, add_colorbars):
    fig, axes = plotpress.subplots(NROWS, NCOLS, figsize=(20, 14))
    flat = axes.ravel()
    x = np.linspace(0, 10, 11)
    y = np.linspace(0, 5, 6)
    X, Y = np.meshgrid(x, y)
    for i, ax in enumerate(flat):
        Z = np.sin(X - 0.3 * i) * np.exp(-0.05 * Y)
        mesh = ax.pcolormesh(x, y, Z, cmap="viridis", vmin=-1, vmax=1)
        ax.tick_params(labelsize=4)
        if add_colorbars:
            fig.colorbar(mesh, ax=ax)
    if add_groups:
        for i in range(0, NROWS * NCOLS, 2):
            fig.group(f"g{i}", [flat[i], flat[i + 1]], title_position="top")
    fig.tight_layout()
    fig.to_svg()


def no_groups():
    _build(add_groups=False, add_colorbars=False)


def fifty_groups():
    _build(add_groups=True, add_colorbars=False)


def fifty_groups_with_colorbars():
    _build(add_groups=True, add_colorbars=True)


WORKLOADS = [
    ("no groups", no_groups),
    ("50 groups", fifty_groups),
    ("50 groups +\n100 colorbars", fifty_groups_with_colorbars),
]
times = [best(fn) for _, fn in WORKLOADS]

labels = [name for name, _ in WORKLOADS]
pos = np.arange(len(labels), dtype=float)

fig, ax = plotpress.subplots(figsize=(7.5, 5.2))
ax.bar(pos, times, width=0.5, color=["#1f77b4", "#2ca02c", "#d62728"])
for p, t in zip(pos, times):
    ax.text(p, t + max(times) * 0.03, f"{t:.0f} ms", ha="center", fontsize=10)
ax.set_xticks(pos, labels)
ax.set_ylabel("fig.to_svg() (ms, best of 5)")
ax.set_title(f"{NROWS}x{NCOLS} = {NROWS * NCOLS} axes, this machine -- lower is better")
ax.set_ylim(0, max(times) * 1.25)
fig.tight_layout()
Total running time of the script: (0 minutes 3.576 seconds)