Note
Go to the end to download the full example code.
A 144-panel image grid under one logarithmic colorbar
Twelve by twelve detector frames, every one on the same colour scale, described by a single colorbar spanning the whole grid.
A shared bar is the only honest way to present a grid like this, and it is a statement about the data, not a saving of space: it says every panel was normalised identically, so a bright patch in one frame means the same number of counts as a bright patch in another. Give each panel its own autoscaled bar and the grid becomes 144 unrelated pictures that happen to be adjacent – every frame looks equally bright, and the dim ones, which are the finding, disappear.
So the limits are computed across the whole stack before anything is drawn, and
fig.colorbar(mesh, ax=<all axes>) steals space from the grid once. The counts
span four decades, so the shared norm is logarithmic; with a linear one the
three bright frames would use the entire ramp and the other 141 would be black.
The exposure that saturated is marked, because a shared scale makes clipping visible and a per-panel scale hides it.
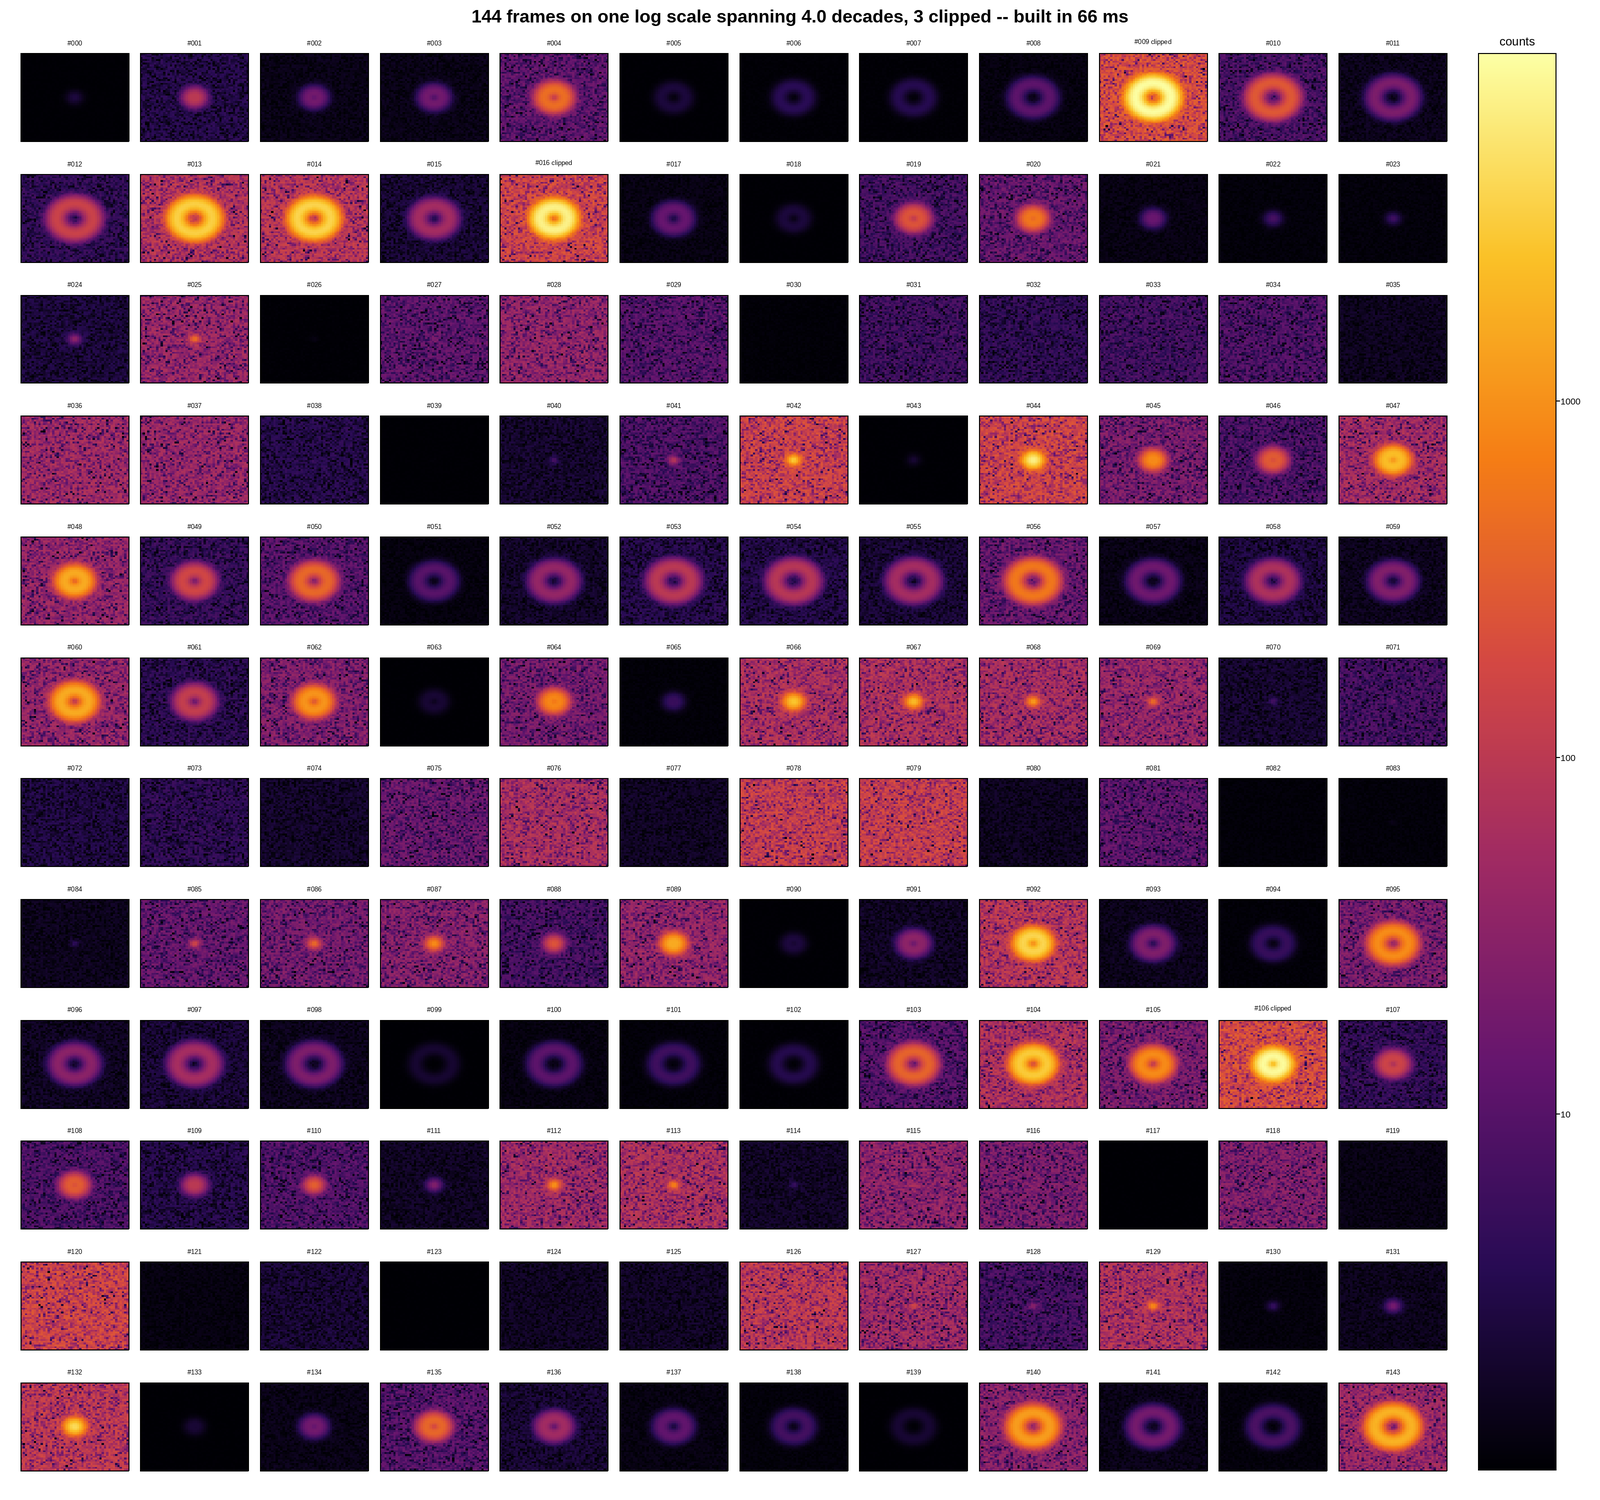
This figure has 144 panels — too many to usefully embed at a fixed size.
Open the full interactive example in a new page to pick a tool, then zoom, pan, point-pick or annotate any panel.
import time

import numpy as np
import plotpress

rng = np.random.default_rng(29)

NROWS = NCOLS = 12
N_PANELS = NROWS * NCOLS
NY = NX = 48

g = np.linspace(-1.0, 1.0, NX)
X, Y = np.meshgrid(g, g)
R = np.hypot(X, Y)

# Frames from a detector whose source brightens and fades over the run: the
# counts span four decades across the stack, which is what forces the log norm.
frames, exposures = [], []
for k in range(N_PANELS):
    gain = 10.0 ** rng.uniform(0.0, 4.0)
    frame = gain * np.exp(-((R - 0.35 * np.sin(k / 7.0)) ** 2) / 0.02)
    frame += gain * 0.04 * rng.random((NY, NX))          # shot noise
    frame += 1.0                                          # dark floor
    frames.append(frame)
    exposures.append(gain)

vmin = max(1.0, min(f.min() for f in frames))
vmax = max(f.max() for f in frames)
SATURATION = 0.75 * vmax

t0 = time.perf_counter()
fig, axes = plotpress.subplots(NROWS, NCOLS, figsize=(16.0, 15.0))
flat = axes.ravel()
norm = plotpress.LogNorm(vmin, vmax)
mesh = None
saturated = 0
for k, (ax, frame) in enumerate(zip(flat, frames)):
    mesh = ax.pcolormesh(g, g, frame, cmap="inferno", norm=norm)
    ax.set_xticks([])
    ax.set_yticks([])
    if frame.max() > SATURATION:
        saturated += 1
        ax.set_title(f"#{k:03d} clipped", size=6.5)
    else:
        ax.set_title(f"#{k:03d}", size=6.5)
fig.tight_layout(pad=0.006)

# One bar for the whole grid: the shared norm is the claim, the bar is its label.
bar = fig.colorbar(mesh, ax=flat)
bar.set_title("counts")

build_ms = (time.perf_counter() - t0) * 1e3
fig.suptitle(f"{N_PANELS} frames on one log scale spanning "
             f"{np.log10(vmax / vmin):.1f} decades, {saturated} clipped -- "
             f"built in {build_ms:.0f} ms")
Total running time of the script: (0 minutes 1.832 seconds)