Note
Go to the end to download the full example code.
Head to head with matplotlib
Four workloads built and serialized through both libraries on the machine that built this page, timed, and drawn with plotpress.
Read the caveats before the bars. This measures figure construction plus
serialization to a vector file – fig.to_svg() against
savefig(format="svg") – because that is the operation a server or a CI job
performs, and it is the operation plotpress is designed around. It is not a
measurement of interactive redraw, of rasterization quality, or of anything
matplotlib is better at, and matplotlib is doing more work in every one of these
cases: it has a richer artist model, a full text layout engine and a backend
abstraction that plotpress simply does not implement.
Where the gap is large it is structural rather than clever. A mesh becomes one embedded image instead of a quarter of a million vector rectangles; a scatter becomes one path instead of N circles; an axes carries a handful of Python objects instead of dozens. Where a workload does not have that structure – a short line on a single axes – the two are much closer, and the last group is included precisely so the chart is not only its best cases.
The ratio is annotated on each pair rather than left to the eye, since a log axis is exactly where readers misjudge ratios.
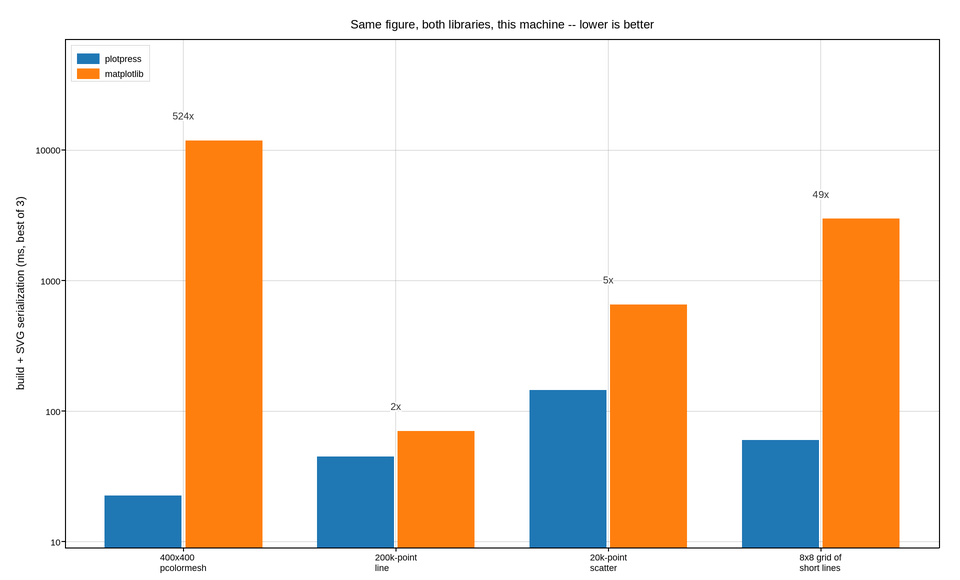
Live figure — pick a tool, then zoom, pan, point-pick or annotate. Nothing is active until a tool is selected.
import io
import time

import numpy as np
import plotpress

rng = np.random.default_rng(0)
REPEAT = 3


def best(fn, repeat=REPEAT):
    """Best-of-N wall time in milliseconds; the minimum is the least noisy."""
    out = float("inf")
    for _ in range(repeat):
        t0 = time.perf_counter()
        fn()
        out = min(out, (time.perf_counter() - t0) * 1e3)
    return out


# -- the four workloads, each defined once per library ----------------------
MESH = rng.random((400, 400))
LINE_X = np.linspace(0, 100, 200_000)
LINE_Y = np.sin(LINE_X) + rng.normal(0, 0.05, LINE_X.size)
PTS_X, PTS_Y = rng.normal(0, 1, 20_000), rng.normal(0, 1, 20_000)


def pp_mesh():
    fig, ax = plotpress.subplots()
    ax.pcolormesh(MESH, cmap="viridis")
    fig.to_svg()


def pp_line():
    fig, ax = plotpress.subplots()
    ax.plot(LINE_X, LINE_Y)
    fig.to_svg()


def pp_scatter():
    fig, ax = plotpress.subplots()
    ax.scatter(PTS_X, PTS_Y, s=4)
    fig.to_svg()


def pp_grid():
    fig, axes = plotpress.subplots(8, 8, figsize=(12, 10))
    for k, ax in enumerate(axes.ravel()):
        ax.plot([0, 1, 2], [0, k % 5, 1])
    fig.tight_layout()
    fig.to_svg()


WORKLOADS = [
    ("400x400\npcolormesh", pp_mesh),
    ("200k-point\nline", pp_line),
    ("20k-point\nscatter", pp_scatter),
    ("8x8 grid of\nshort lines", pp_grid),
]

mpl_times = None
try:
    import matplotlib
    matplotlib.use("Agg")
    import matplotlib.pyplot as plt

    def _mpl(build):
        buf = io.StringIO()
        fig = build()
        fig.savefig(buf, format="svg")
        plt.close(fig)

    def mpl_mesh():
        def build():
            f, a = plt.subplots()
            a.pcolormesh(MESH, cmap="viridis")
            return f
        _mpl(build)

    def mpl_line():
        def build():
            f, a = plt.subplots()
            a.plot(LINE_X, LINE_Y)
            return f
        _mpl(build)

    def mpl_scatter():
        def build():
            f, a = plt.subplots()
            a.scatter(PTS_X, PTS_Y, s=4)
            return f
        _mpl(build)

    def mpl_grid():
        def build():
            f, axs = plt.subplots(8, 8, figsize=(12, 10))
            for k, a in enumerate(axs.ravel()):
                a.plot([0, 1, 2], [0, k % 5, 1])
            f.tight_layout()
            return f
        _mpl(build)

    mpl_times = [best(fn) for fn in (mpl_mesh, mpl_line, mpl_scatter, mpl_grid)]
except ImportError:
    pass                                  # a plain install has no matplotlib

pp_times = [best(fn) for _, fn in WORKLOADS]

labels = [name for name, _ in WORKLOADS]
pos = np.arange(len(labels), dtype=float)

fig, ax = plotpress.subplots(figsize=(9.6, 5.8))
ax.bar(pos - 0.19, pp_times, width=0.36, color="#1f77b4", label="plotpress")
if mpl_times is not None:
    ax.bar(pos + 0.19, mpl_times, width=0.36, color="#ff7f0e", label="matplotlib")
    for p, a, b in zip(pos, pp_times, mpl_times):
        ax.text(p, max(a, b) * 1.45, f"{b / a:.0f}x", ha="center", fontsize=10,
                color="#333333")
else:
    ax.text(pos.mean(), max(pp_times), "matplotlib not installed:\n"
            "plotpress timings only", ha="center", fontsize=10, color="#d62728")

ax.set_yscale("log")
# Headroom for the ratio labels above the tallest bar, and for the legend above
# those -- on a log axis a fixed multiplier is the only offset that holds.
tallest = max(pp_times + (mpl_times or []))
ax.set_ylim(min(pp_times) * 0.4, tallest * 6.0)
ax.set_xticks(pos, labels)
ax.set_ylabel("build + SVG serialization (ms, best of 3)")
ax.set_title("Same figure, both libraries, this machine -- lower is better")
ax.legend(loc="upper left")
ax.grid(True)
fig.tight_layout()
Total running time of the script: (0 minutes 59.238 seconds)