Note
Go to the end to download the full example code.
A mesh of two and a quarter million cells
A 1500 x 1500 pcolormesh. As vector output that is 2,250,000 <rect>
elements – somewhere north of 200 MB of SVG, and a file no browser will open.
plotpress can emit mesh cells as vector <rect> nodes – see
docs/examples/limitations/plot_04_pcolormesh_vs_imshow.py – but only for a
non-uniform grid under about 2000 cells, where the SVG cost is trivial and the
payoff (no cell too thin to draw) is real. This grid is uniform and the
wrong end of that trade by six orders of magnitude, so it takes the raster
path regardless: the field is normalised, mapped through the colormap LUT as
a single vectorized NumPy operation, encoded as a PNG with the standard
library’s zlib, and embedded as one <image> element with a base64
data URI. The SVG node count for the mesh is therefore one, independent
of the mesh size, and the file size is the size of a compressed image rather
than of 2.25 million coordinate strings.
That is a genuine trade-off and worth stating plainly: the mesh layer is raster, so it does not stay sharp when the SVG is scaled up, while the axes, ticks, labels and any line artists over it remain vector. For a field sampled far finer than the display it is the right trade – there is no vector detail to preserve that the screen could show – and for a coarse mesh where the cell edges are the point it is the wrong one.
The colorbar is built from the same LUT, so it describes the image exactly rather than approximately.
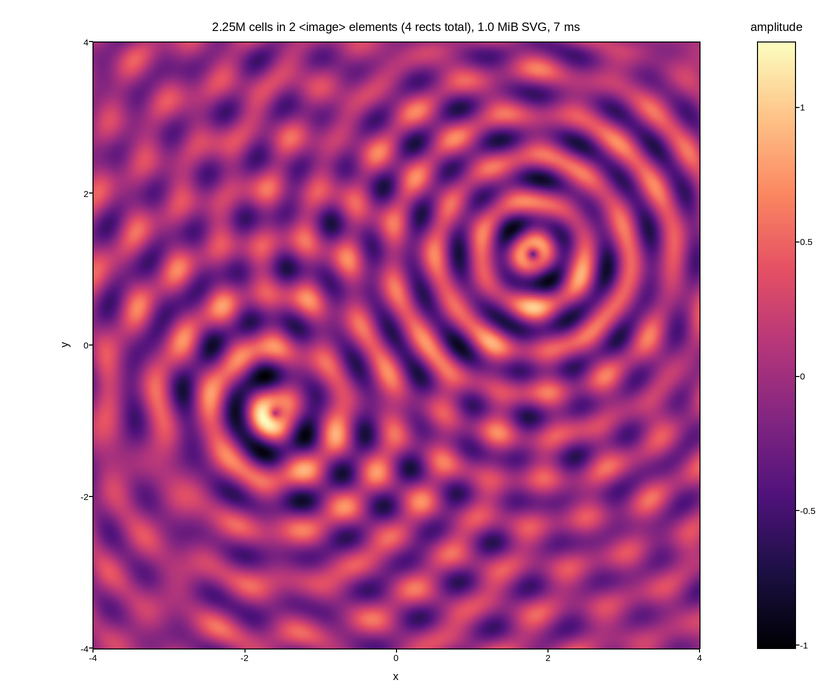
Live figure — pick a tool, then zoom, pan, point-pick or annotate. Nothing is active until a tool is selected.
import time

import numpy as np
import plotpress

N = 1500                                        # 1500 x 1500 = 2.25M cells

g = np.linspace(-4.0, 4.0, N)
X, Y = np.meshgrid(g, g)

# An interference pattern: detail at the pixel scale everywhere, so nothing
# about the field is redundant at this resolution.
R1 = np.hypot(X + 1.6, Y + 0.9)
R2 = np.hypot(X - 1.8, Y - 1.2)
Z = np.sin(9.0 * R1) / (1.0 + R1) + np.sin(11.0 * R2) / (1.0 + R2)
Z += 0.25 * np.sin(6.0 * X) * np.cos(6.0 * Y)

t0 = time.perf_counter()
fig, ax = plotpress.subplots(figsize=(8.4, 7.0))
mesh = ax.pcolormesh(g, g, Z, cmap="magma")
bar = fig.colorbar(mesh, ax=ax)
bar.set_title("amplitude")
ax.set_aspect("equal")
ax.set_xlabel("x")
ax.set_ylabel("y")
fig.tight_layout()
build_ms = (time.perf_counter() - t0) * 1e3

svg = fig.to_svg()
images = svg.count("<image")
rects = svg.count("<rect")
ax.set_title(f"{N * N / 1e6:.2f}M cells in {images} <image> elements "
             f"({rects} rects total), {len(svg) / 1024 / 1024:.1f} MiB SVG, "
             f"{build_ms:.0f} ms")
Total running time of the script: (0 minutes 1.708 seconds)