Note
Go to the end to download the full example code.
Nine hundred line panels on one canvas
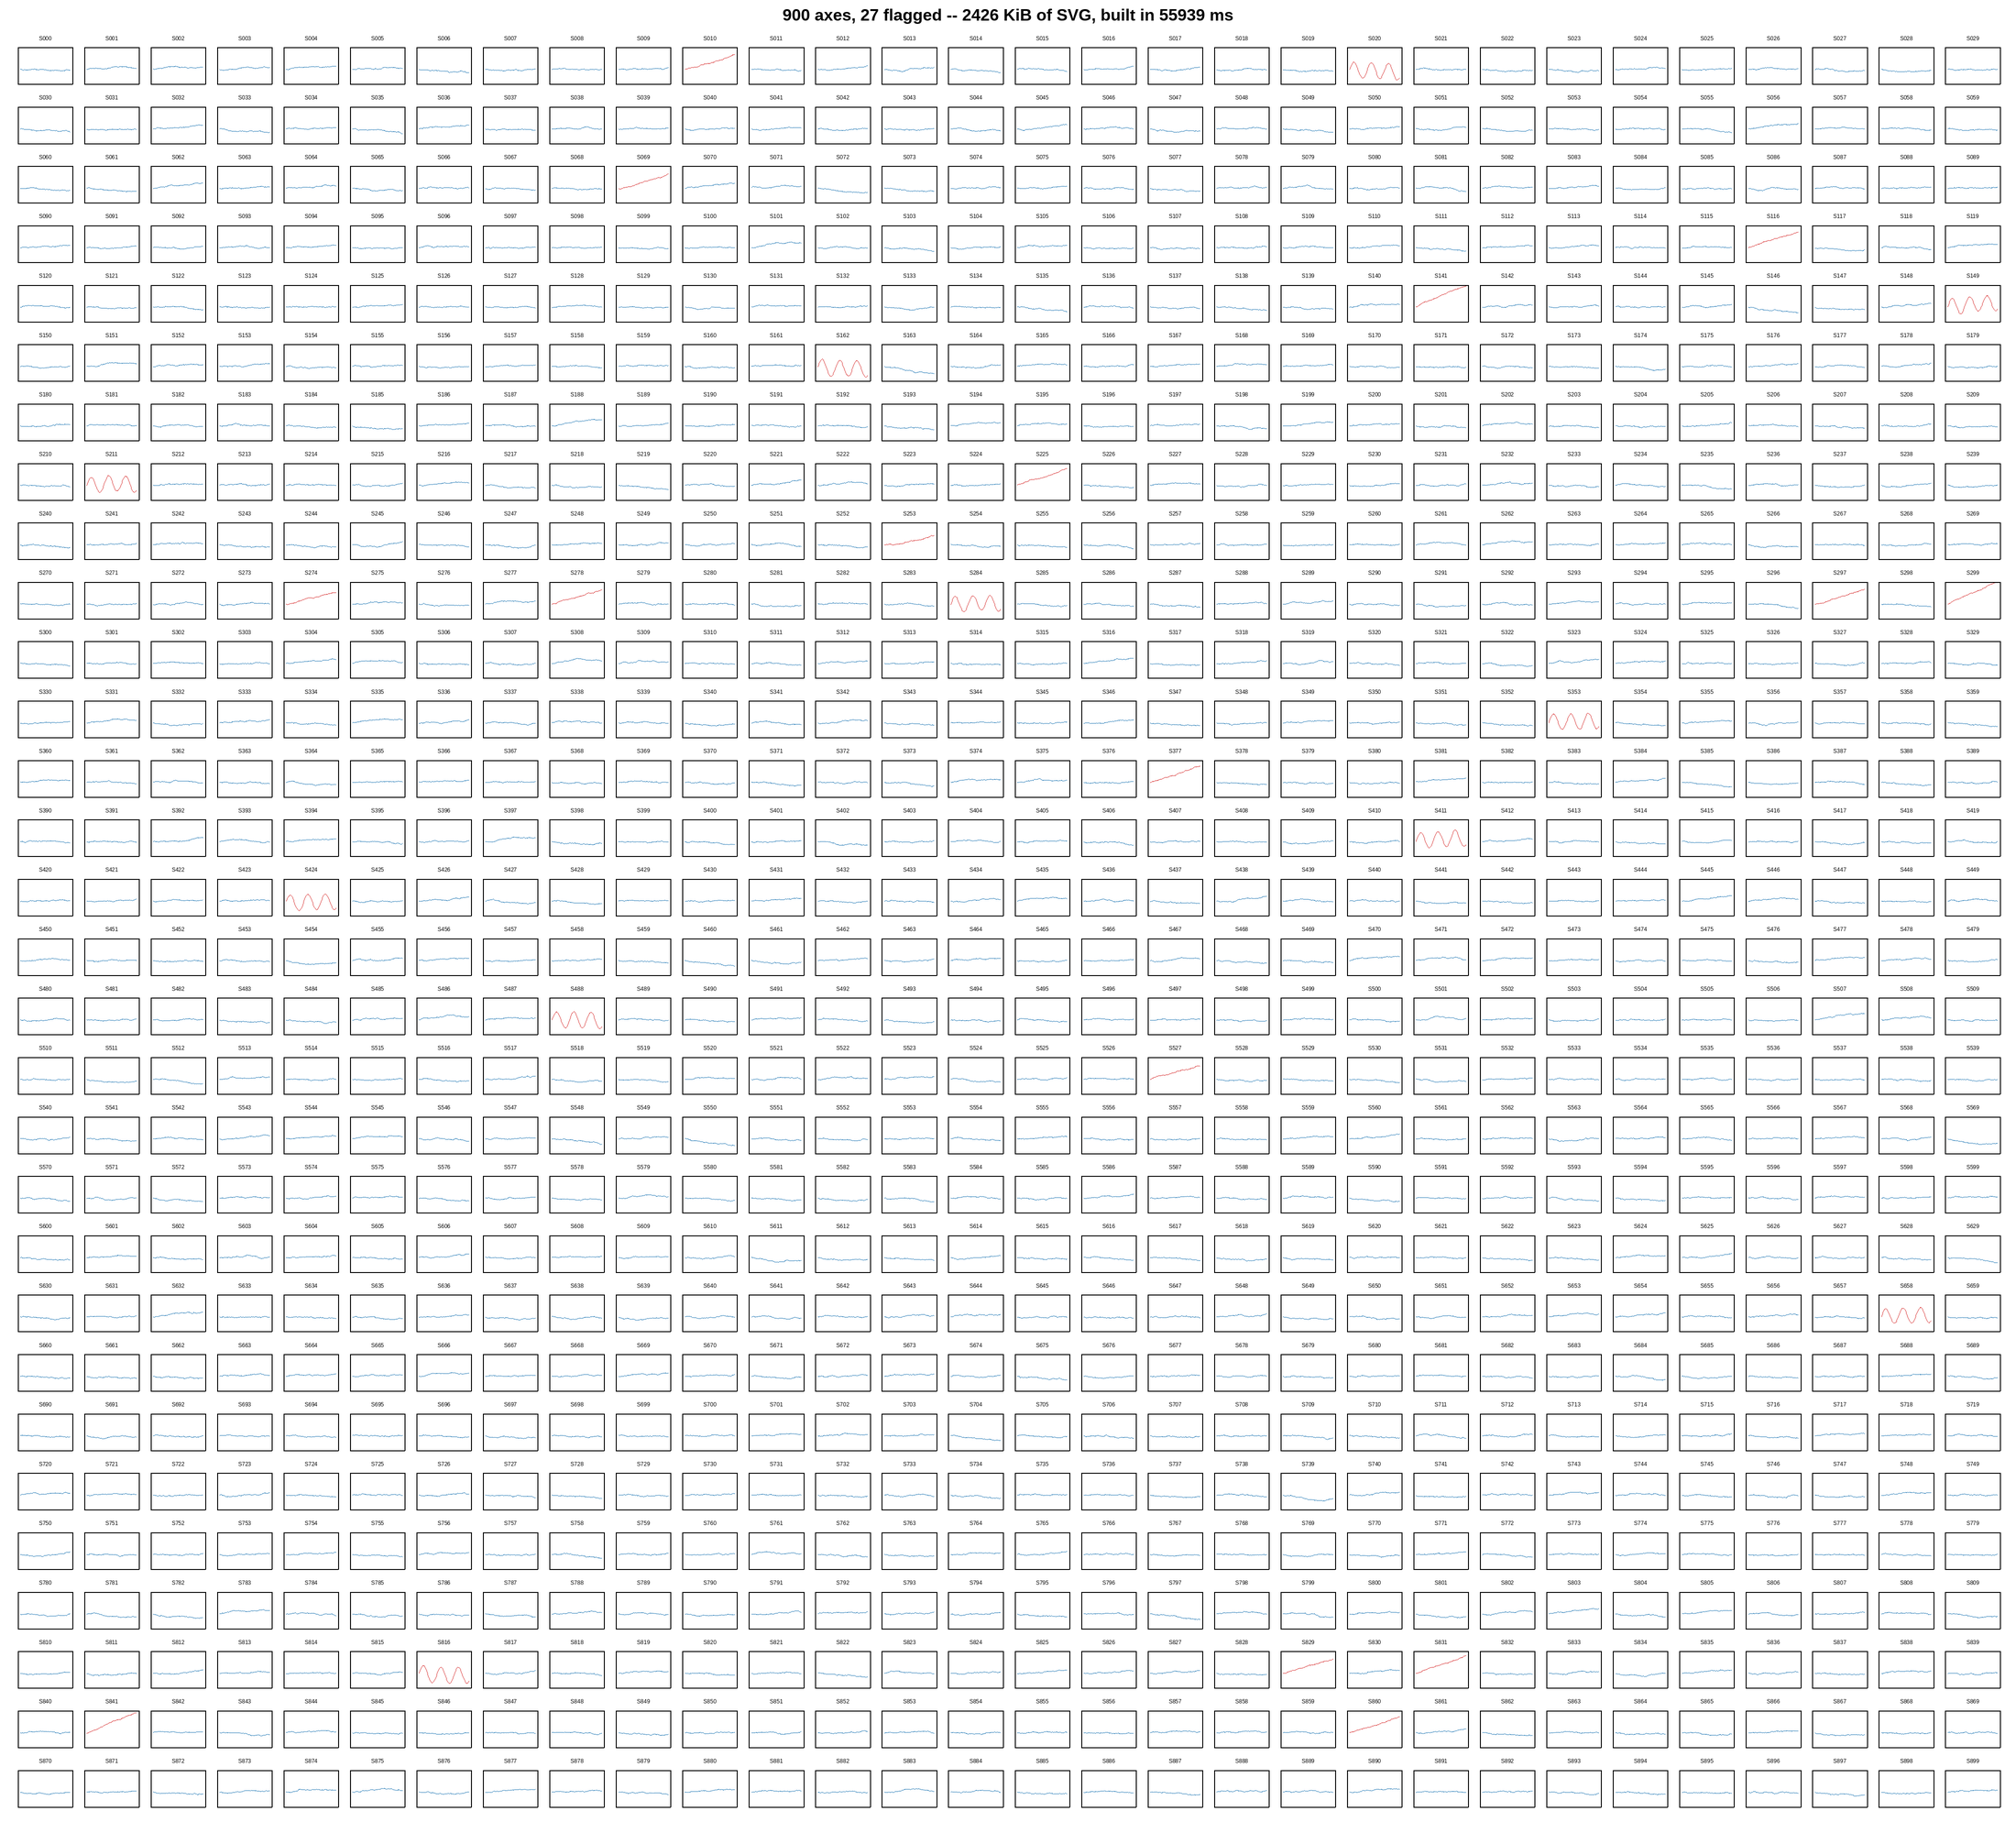
A 30 x 30 small-multiples grid: 900 independent axes, each with its own series, its own limits and its own frame. The mesh examples elsewhere in this gallery stress the raster path; this one stresses everything else – layout, autoscaling, tick generation, spines – because none of it is amortised across axes.
At this size the per-axes furniture is the cost, and the figure is designed around that rather than fighting it. Ticks and tick labels are switched off: at 900 panels each one is about 40 pixels tall, so a tick label would be unreadable and would still cost a font measurement, a layout decision and an SVG node. What survives is the frame, the trace and one small title, which is all a small-multiples grid is read for – shape and outliers, not values.
The panels that break their own control band are drawn in red, which is the entire point of a grid this size: nobody reads 900 panels, they scan for the handful that look different, so the figure has to do the finding.
This figure has 900 panels — too many to usefully embed at a fixed size.
Open the full interactive example in a new page to pick a tool, then zoom, pan, point-pick or annotate any panel.
import time

import numpy as np
import plotpress

rng = np.random.default_rng(3)

NROWS = NCOLS = 30
N_AXES = NROWS * NCOLS
N_POINTS = 120
x = np.arange(N_POINTS)

# Most sensors are well behaved; a few drift or start oscillating.
series, faulty = [], []
for k in range(N_AXES):
    y = rng.normal(0.0, 0.25, N_POINTS).cumsum() * 0.15
    bad = rng.random() < 0.04
    if bad:
        if rng.random() < 0.5:
            y += np.linspace(0.0, rng.uniform(2.5, 4.0), N_POINTS)   # drift
        else:
            y += 1.6 * np.sin(np.linspace(0, 18, N_POINTS))          # oscillation
    series.append(y)
    faulty.append(bad or np.abs(y).max() > 1.8)

t0 = time.perf_counter()
fig, axes = plotpress.subplots(NROWS, NCOLS, figsize=(22.0, 20.0),
                               sharex=True, sharey=True)
flat = axes.ravel()
for k, (ax, y, bad) in enumerate(zip(flat, series, faulty)):
    ax.plot(x, y, color="#d62728" if bad else "#1f77b4", linewidth=0.7)
    # No ticks at 40 px per panel: they cost layout and font measurement and
    # would be unreadable anyway. The frame and the shape are the message.
    ax.set_xticks([])
    ax.set_yticks([])
    ax.set_title(f"S{k:03d}", size=6)

flat[0].set_ylim(-3.0, 4.5)
fig.tight_layout(pad=0.004)
build_ms = (time.perf_counter() - t0) * 1e3

svg = fig.to_svg()
fig.suptitle(f"{N_AXES} axes, {sum(faulty)} flagged -- "
             f"{len(svg) / 1024:.0f} KiB of SVG, built in {build_ms:.0f} ms")
Total running time of the script: (4 minutes 27.513 seconds)