Note
Go to the end to download the full example code.
A one-million-point line
A single series with a million samples, drawn as one <path>.
The naive cost of this figure is not the arithmetic, it is the output: a
million points formatted as x,y pairs is roughly 12 MB of coordinate text,
and no viewer benefits from it, because the axes is only about 900 pixels wide.
There cannot be more than two visible extremes per pixel column.
So the line is decimated before serialization: the x range is divided into buckets a fraction of a pixel wide, and each bucket contributes only its minimum and maximum. That is the one decimation that is safe for a line plot – it preserves the drawn silhouette exactly, including single-sample spikes, because a spike is by definition the extreme of its bucket. Averaging or subsampling would both erase it.
The figure reports the reduction. The spike planted in the middle of the series survives it, which is the point: this is a lossless simplification of the rendered result, not of the data.
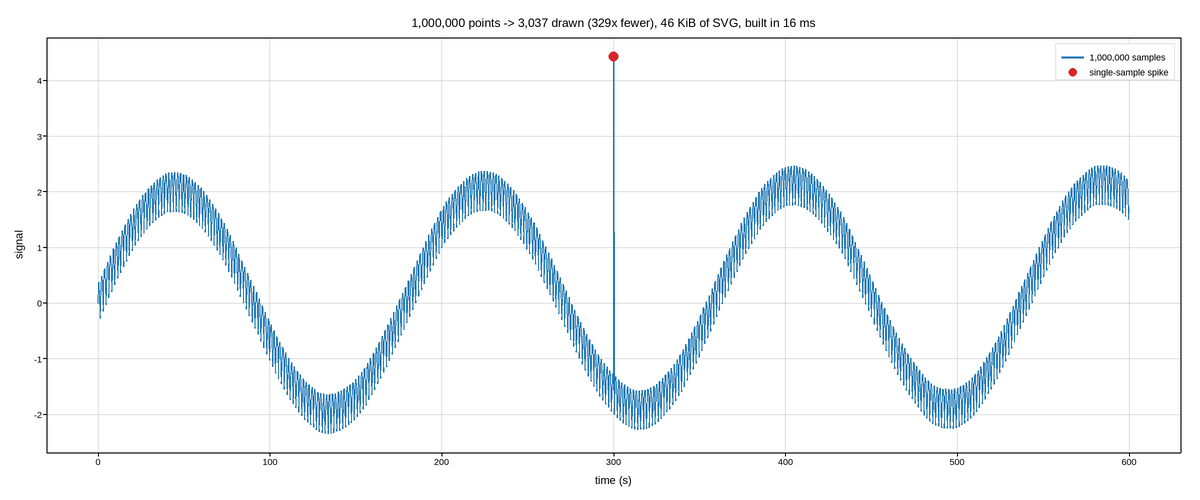
Live figure — pick a tool, then zoom, pan, point-pick or annotate. Nothing is active until a tool is selected.
import time

import numpy as np
import plotpress

rng = np.random.default_rng(0)

N = 1_000_000
t = np.linspace(0.0, 600.0, N)

# A slow carrier, a fast ripple, and a random walk, so the trace has structure
# at every scale a decimator could plausibly destroy.
y = (2.0 * np.sin(2 * np.pi * t / 180.0)
     + 0.35 * np.sin(2 * np.pi * t / 1.7)
     + np.cumsum(rng.normal(0.0, 0.004, N)) / np.sqrt(N) * 30.0)

# One sample, one bucket wide: the test of whether decimation keeps extremes.
SPIKE = N // 2
y[SPIKE] += 6.0

t0 = time.perf_counter()
fig, ax = plotpress.subplots(figsize=(12.0, 5.0))
ax.plot(t, y, color="#1f77b4", linewidth=0.8, label=f"{N:,} samples")
ax.scatter([t[SPIKE]], [y[SPIKE]], s=7.0, color="#d62728",
           label="single-sample spike")
ax.set_xlabel("time (s)")
ax.set_ylabel("signal")
ax.legend(loc="upper right")
ax.grid(True)
fig.tight_layout()
build_ms = (time.perf_counter() - t0) * 1e3

svg = fig.to_svg()
# Count the coordinate pairs that actually reached the file.
drawn = svg.count("L", svg.find('class="plotpress-series"'))
ax.set_title(f"{N:,} points -> {drawn:,} drawn ({N / max(drawn, 1):.0f}x fewer), "
             f"{len(svg) / 1024:.0f} KiB of SVG, built in {build_ms:.0f} ms")
Total running time of the script: (0 minutes 0.801 seconds)