Coordinate and pixel accuracy
Important
The coordinate guarantee
plotpress’s own transform uses NumPy to map every Cartesian (x, y)
value to a floating-point pixel position. Both the SVG and PNG paths use
that same transform; common lines, markers, polygons, and images also share
the same pixel-space geometry. The browser draws SVG, Pillow draws PNG,
and svglib/reportlab converts that SVG to PDF. None of these packages
chooses the data coordinate.
The guarantee is therefore specific and testable: a valid data coordinate is mapped to the pixel position defined below, independent of output format. SVG can round the position by at most 0.005 figure pixel. A physical screen or raster file can cover adjacent pixels through antialiasing, and cannot show detail finer than its resolution; those are rendering limits, not a second coordinate calculation.
From data to the drawing surface
For an axes rectangle (left, top, width, height), a linear coordinate is
mapped by two direct expressions (a log axis applies log10 first):
pixel_x = left + ((x - xmin) / (xmax - xmin)) * width
pixel_y = top  + ((ymax - y) / (ymax - ymin)) * height
The reversed y expression is intentional: data coordinates increase upward, while SVG and image rows increase downward.
The complete path has one shared coordinate-mapping stage:
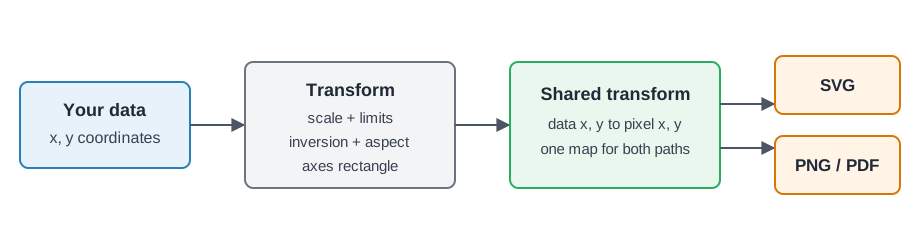
Limits, axis inversion, aspect constraints, and layout are settled first. Values outside the limits are clipped at the axes boundary. Invalid values, including non-positive values on a log axis, have no drawable position.
What z means
plotpress currently draws 2-D Cartesian or polar axes; it does not silently
project a third spatial coordinate onto the page. Depending on the call,
z can mean one of three explicit things:
Input |
Controls |
Does not control |
|---|---|---|
|
z selects each cell’s colour |
the cell’s x/y position |
|
z selects each marker’s colour |
the marker’s x/y position |
|
the interactive pick readout |
drawn geometry |
|
which artist is painted on top |
a spatial z coordinate |
In short: x/y answer where, a field or colour value answers what is there,
and zorder answers what is in front.
Images and meshes
imshow(A, extent=(xmin, xmax, ymin, ymax), origin=...) places the outer
image edges exactly at that data extent. With the default
interpolation="nearest", SVG asks the browser to keep cells as crisp pixel
blocks. origin="upper" puts array row 0 at the top; origin="lower"
flips it deliberately.
For rectilinear pcolormesh, a 1-D coordinate vector with one more value
than z supplies cell edges. A vector with the same length supplies cell
centres; plotpress derives midpoint edges. Descending coordinates and their
data are flipped together, keeping each value in its original cell.
A uniform mesh is an exact one-cell-to-one-sample raster. By default, a small
non-uniform rectilinear mesh uses exact SVG/PDF rectangles. Its raster path is
capped at 1024 samples per axis; plotpress warns and reports
mesh.dropped_x/mesh.dropped_y if a cell receives no sample. Use
rasterized=False when every rectilinear cell must remain vector geometry.
A curvilinear mesh has no vector path. It is scan-converted onto a raster whose longest side is 512 samples, and plotpress cannot currently report which curved cells receive no sample. Increasing final PNG DPI improves output sampling, but does not restore a cell already lost inside either mesh raster.
Precision boundaries and verification
Coordinates remain floating point until SVG serialization or raster drawing.
PNG export supersamples and downsamples by default (scale=2); increasing
dpi gives lines and markers more addressable output pixels. Avoid JPEG
when individual colours matter because it is lossy.
One deliberate reduction occurs for lines with more than 5000 points and monotonic x: plotpress keeps the first, last, minimum-y, and maximum-y samples per pixel column. This preserves visible spikes but does not retain every original vertex. Use markers or split the line when every individual sample must appear explicitly.
For a high-consequence figure, pin the limits, mark check points, and inspect the mesh decision:
fig, ax = plotpress.subplots()
mesh = ax.pcolormesh(x_edges, y_edges, z, rasterized=None)
ax.scatter(x_check, y_check, marker="+", color="black",
           values={"z": z_check})
ax.set_xlim(xmin, xmax)
ax.set_ylim(ymin, ymax)

print(mesh.vectorized, mesh.dropped_x, mesh.dropped_y)
fig.save("audit.svg")
fig.save("audit.html", interactive=True)
SVG keeps inspectable vector coordinates; interactive point picking reports x/y and attached values. Picking precision and payload limits affect the readout, not drawing geometry; see Interactive figures. Tests cover linear and log transform positions, inverted axes, image origin, descending mesh coordinates, vector/raster mesh placement, and browser clicks at renderer-computed pixels.