Live streaming
plotpress.qt.LiveArtist streams data into a Qt window as it’s collected –
patching the already-loaded page in place rather than reloading it, so it
holds tens of Hz even on large lines and meshes where a full reload would
collapse to 4-5 Hz. See the “Streaming live data” section of
Viewing figures for the API itself and the measured numbers.
The examples here can’t drive a real QWebEngineView at doc-build time
(CI has no Qt binding installed), so each renders the same acquisition
sequence a LiveArtist would show live, frame by frame, as a GIF instead.
Acquisition patterns covers the shapes data arrives in in the abstract
(sparse vs. dense, growing vs. fixed extent); Lab instrument examples
puts those shapes into the specific instruments a working lab actually
watches update in real time.
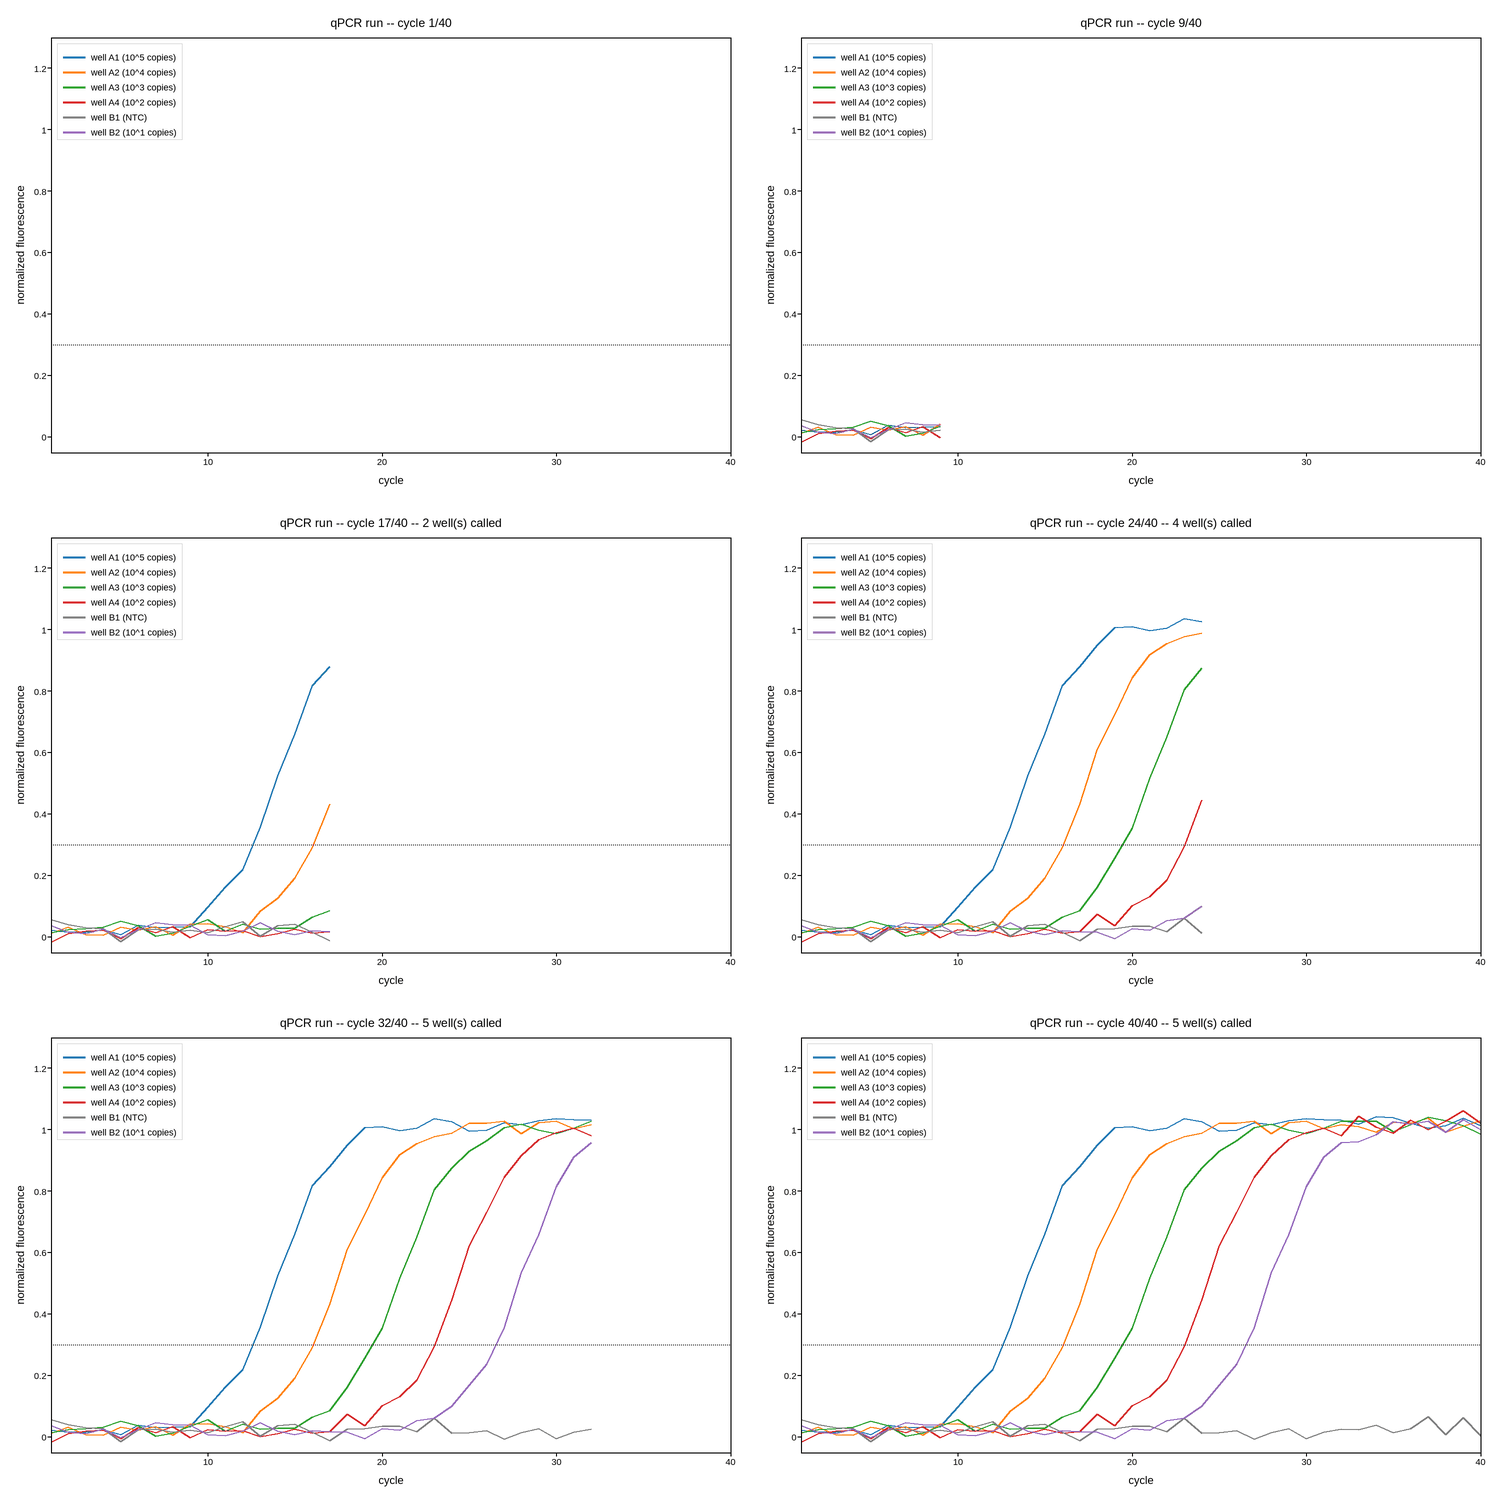
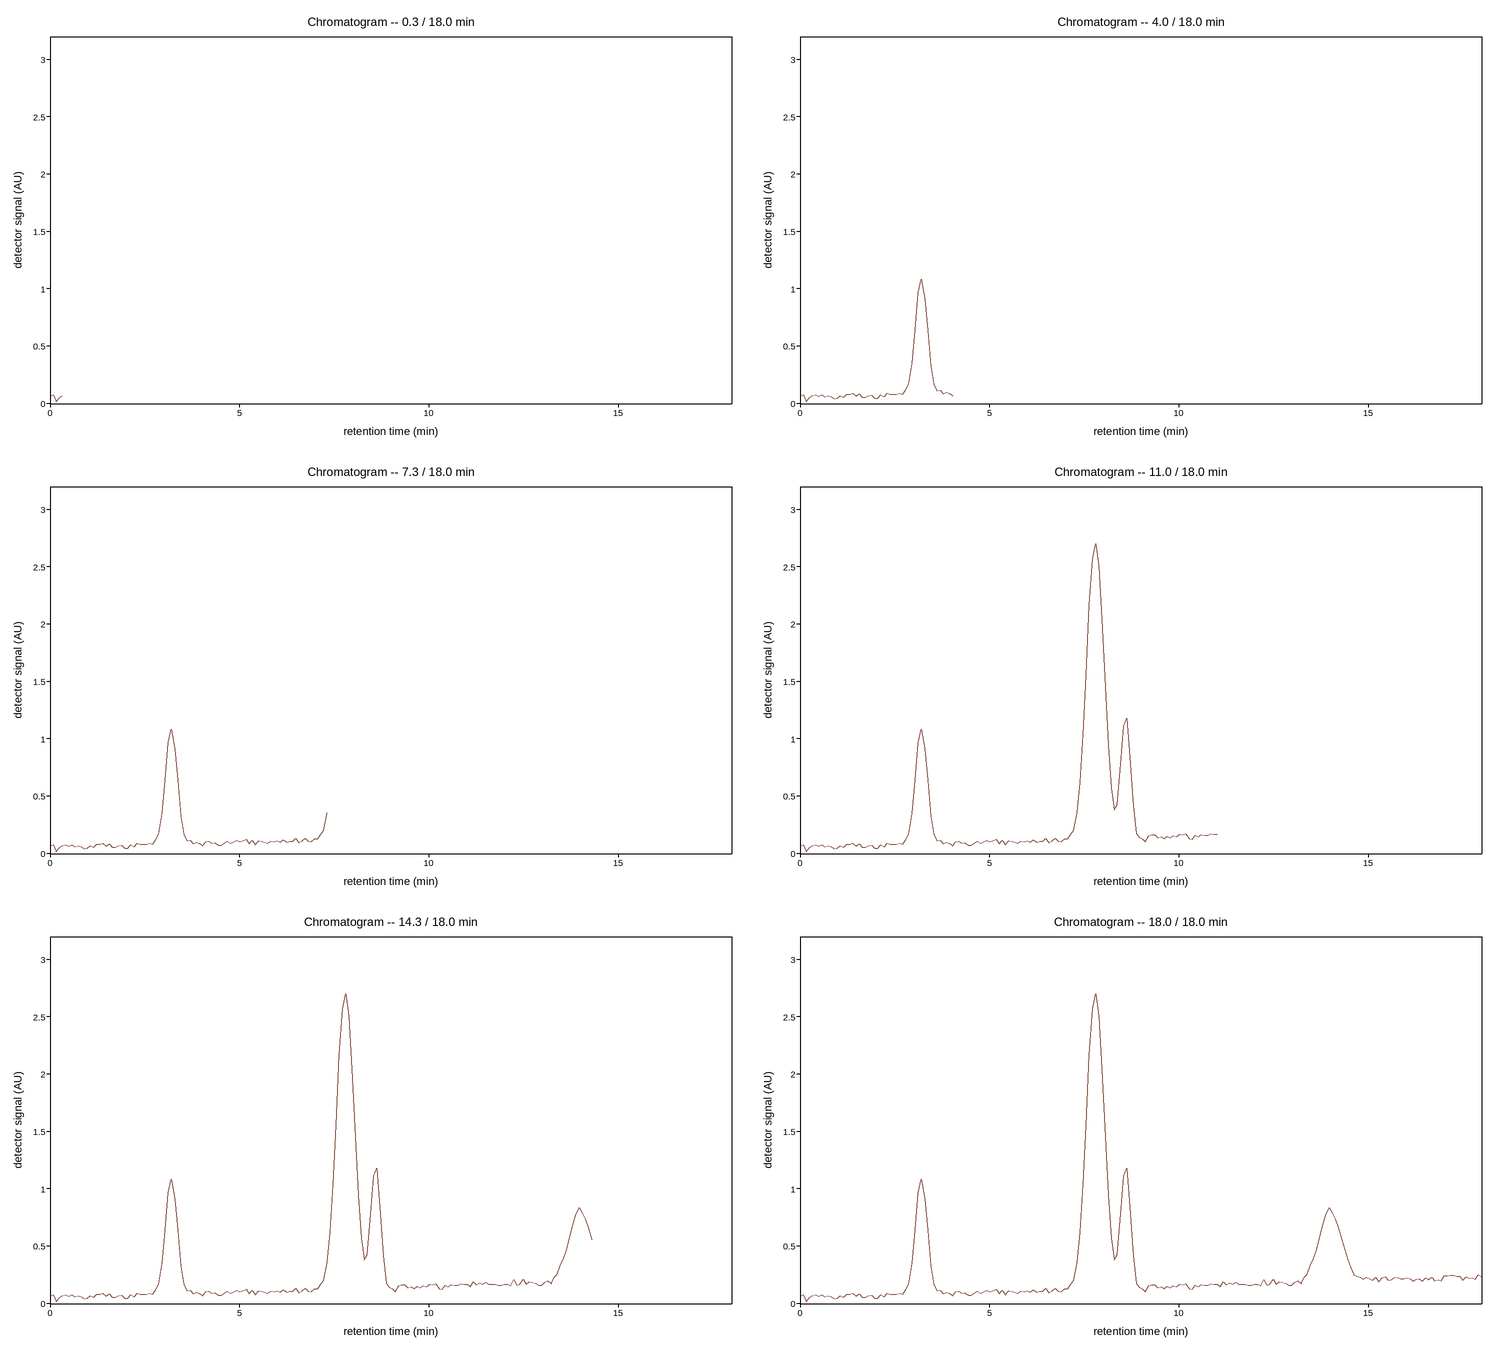
Every example is split the same way real acquisition code would be: a callback that receives new data and pushes it to the plot (unchanged when you swap in a real Qt window), fed by a loop that simulates an instrument (the part meant to be replaced with your own driver). Copy one, swap its data source for real hardware, and the plotting side needs no other change.
Acquisition patterns
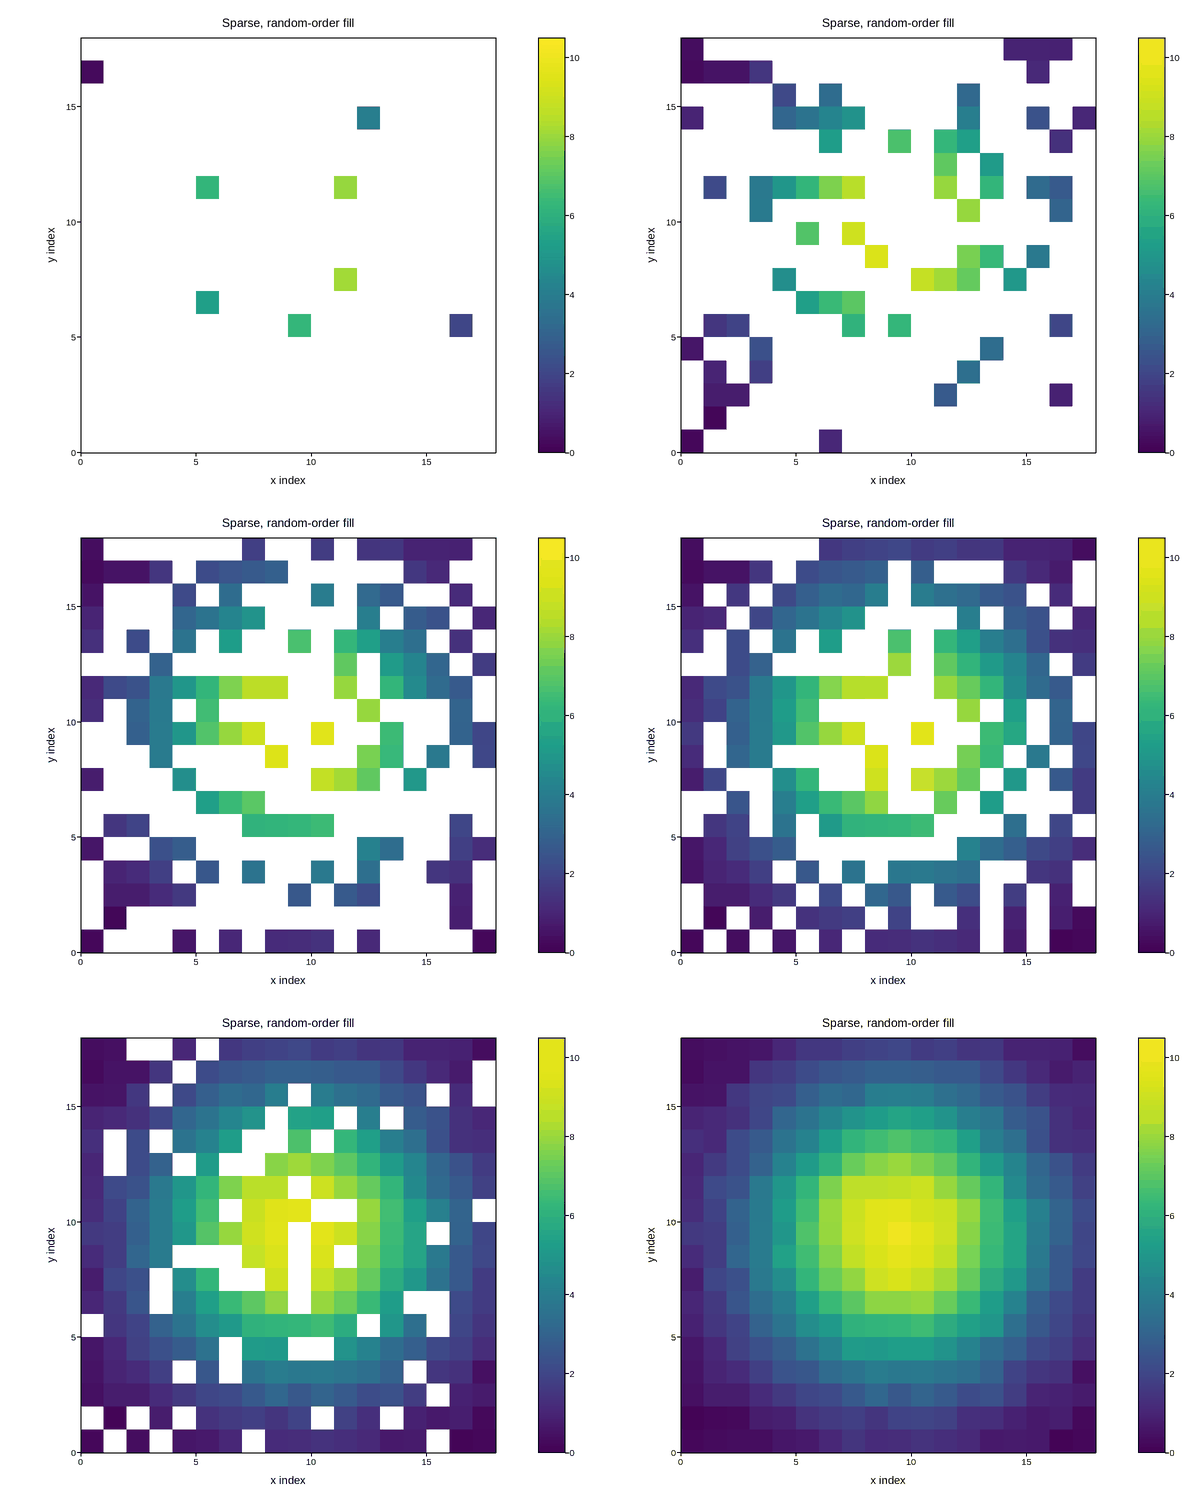
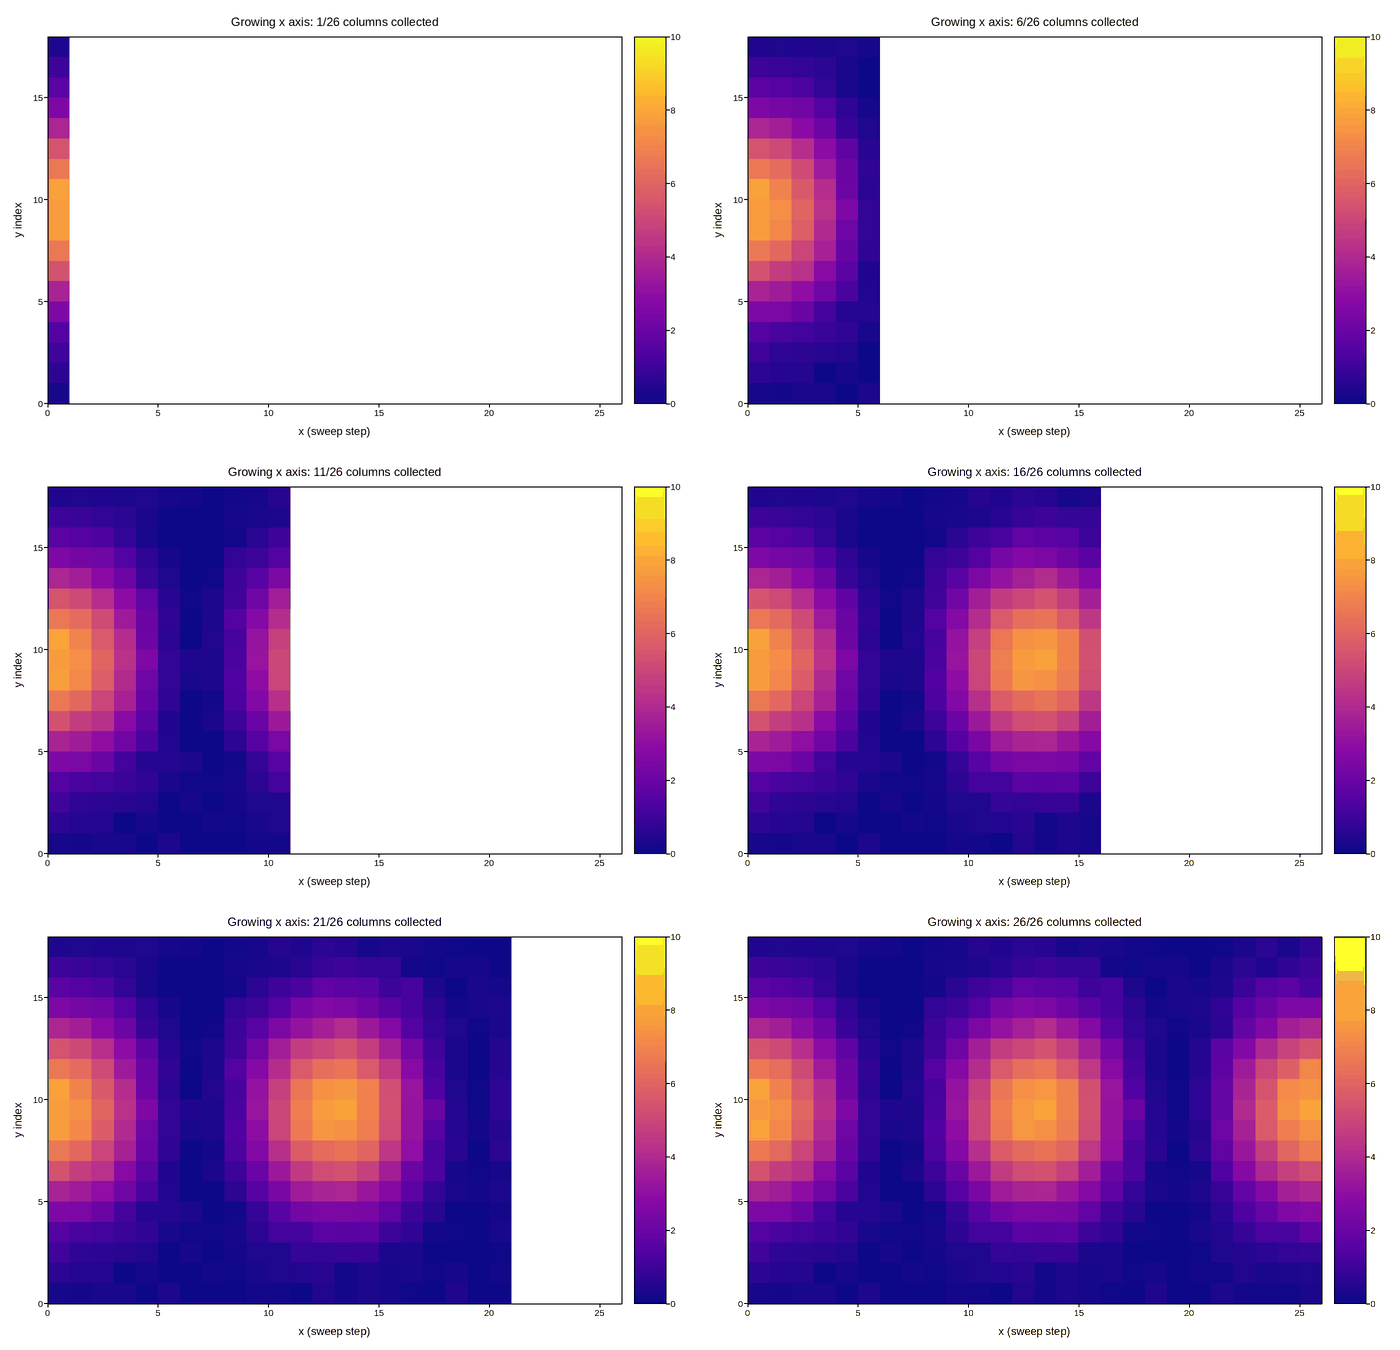
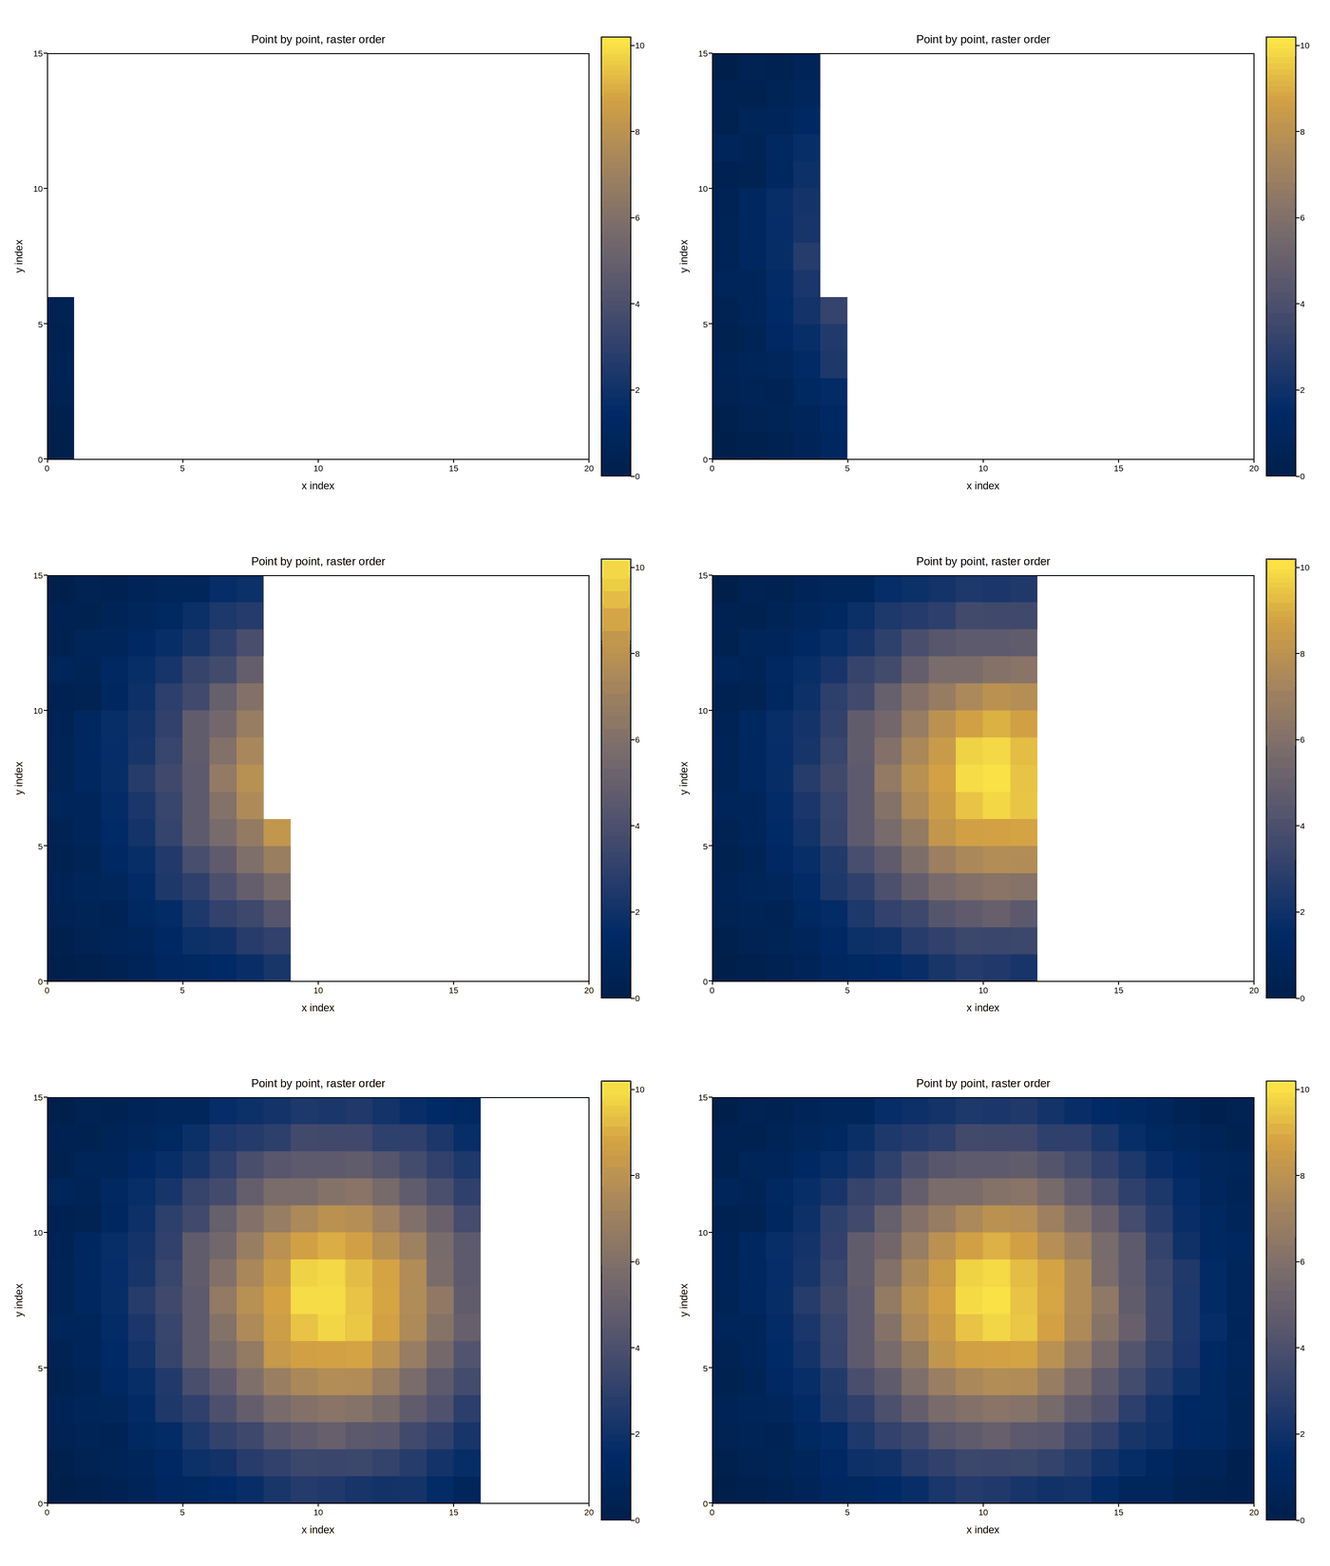
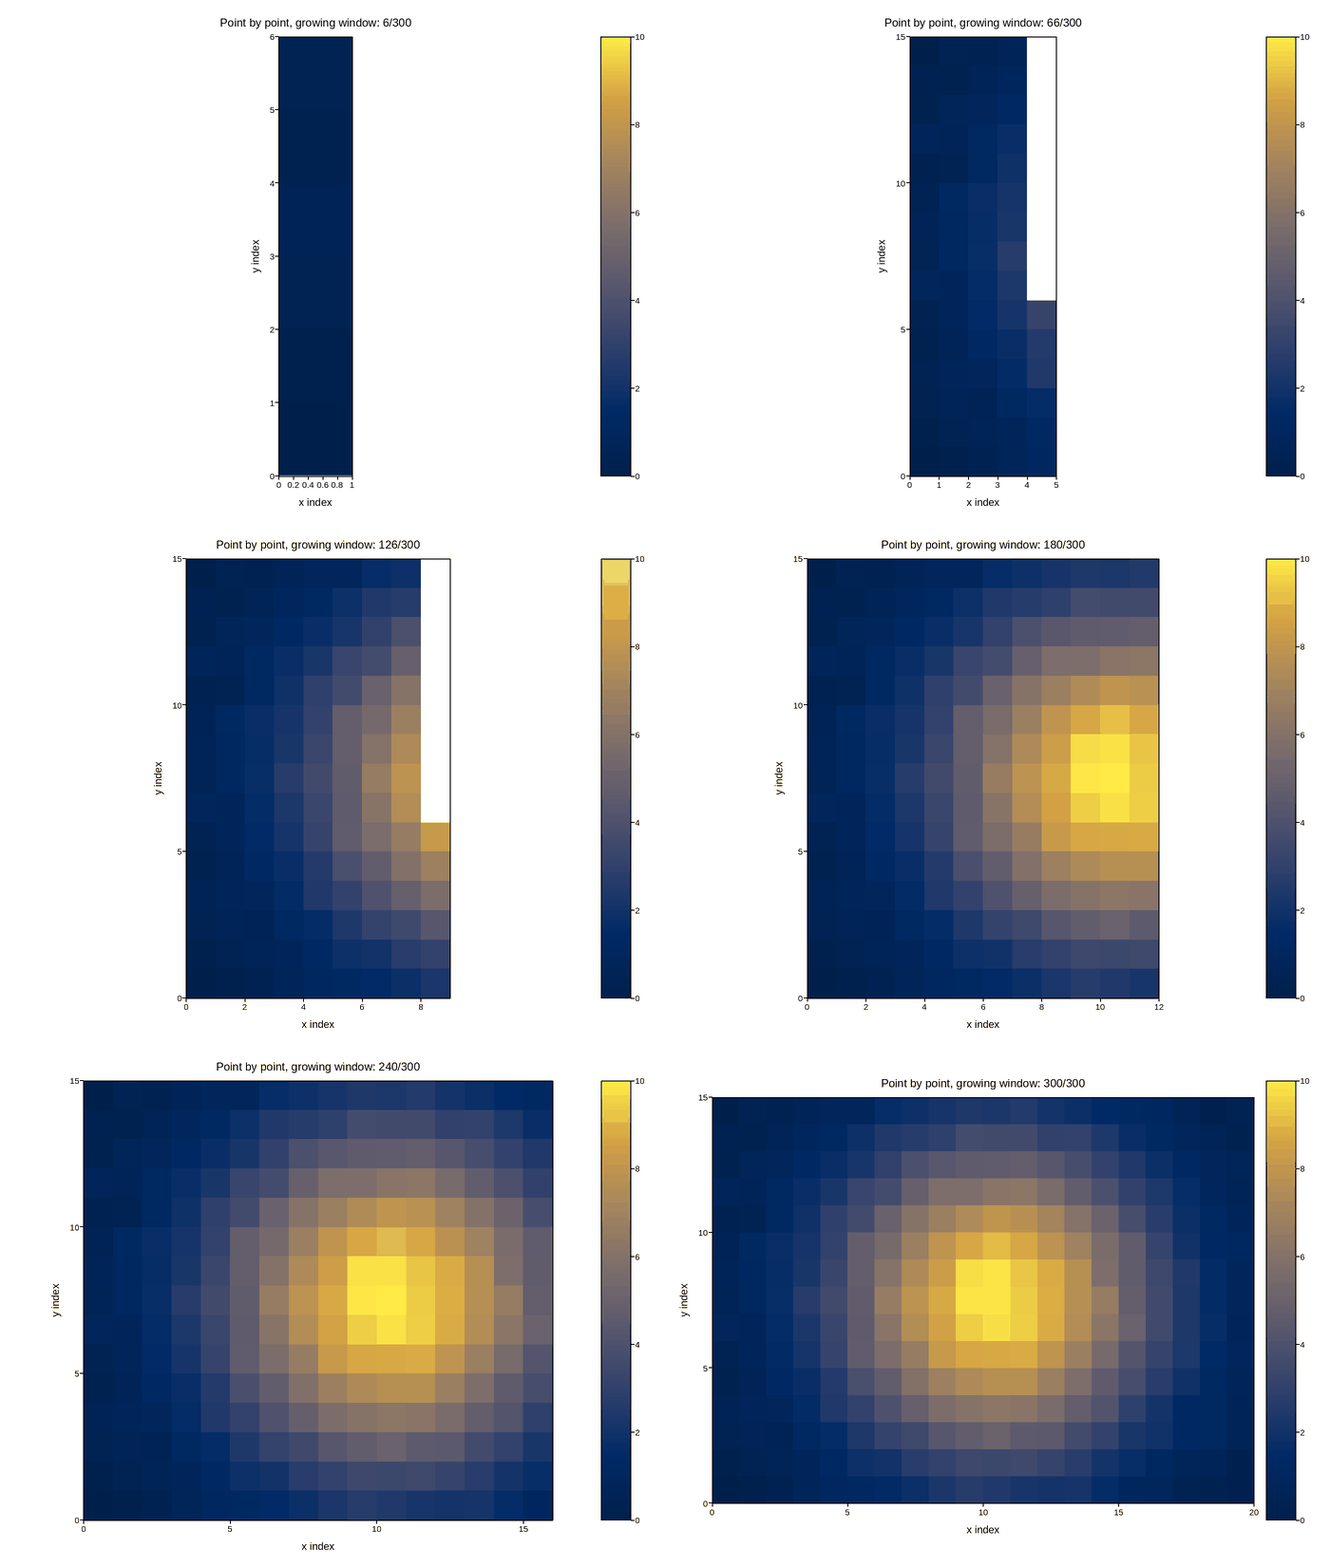
The shapes a real 2-D sweep – a lock-in scan, a resonance map, a scope trace stepping through its sweep window – actually arrives in: sparse or dense, raster-ordered or random, over a grid that’s known up front or one that grows as new extremes come in. Every example here renders that acquisition sequence as a GIF, frame by frame, for illustration; see Lab instrument examples for these same shapes applied to specific instruments.
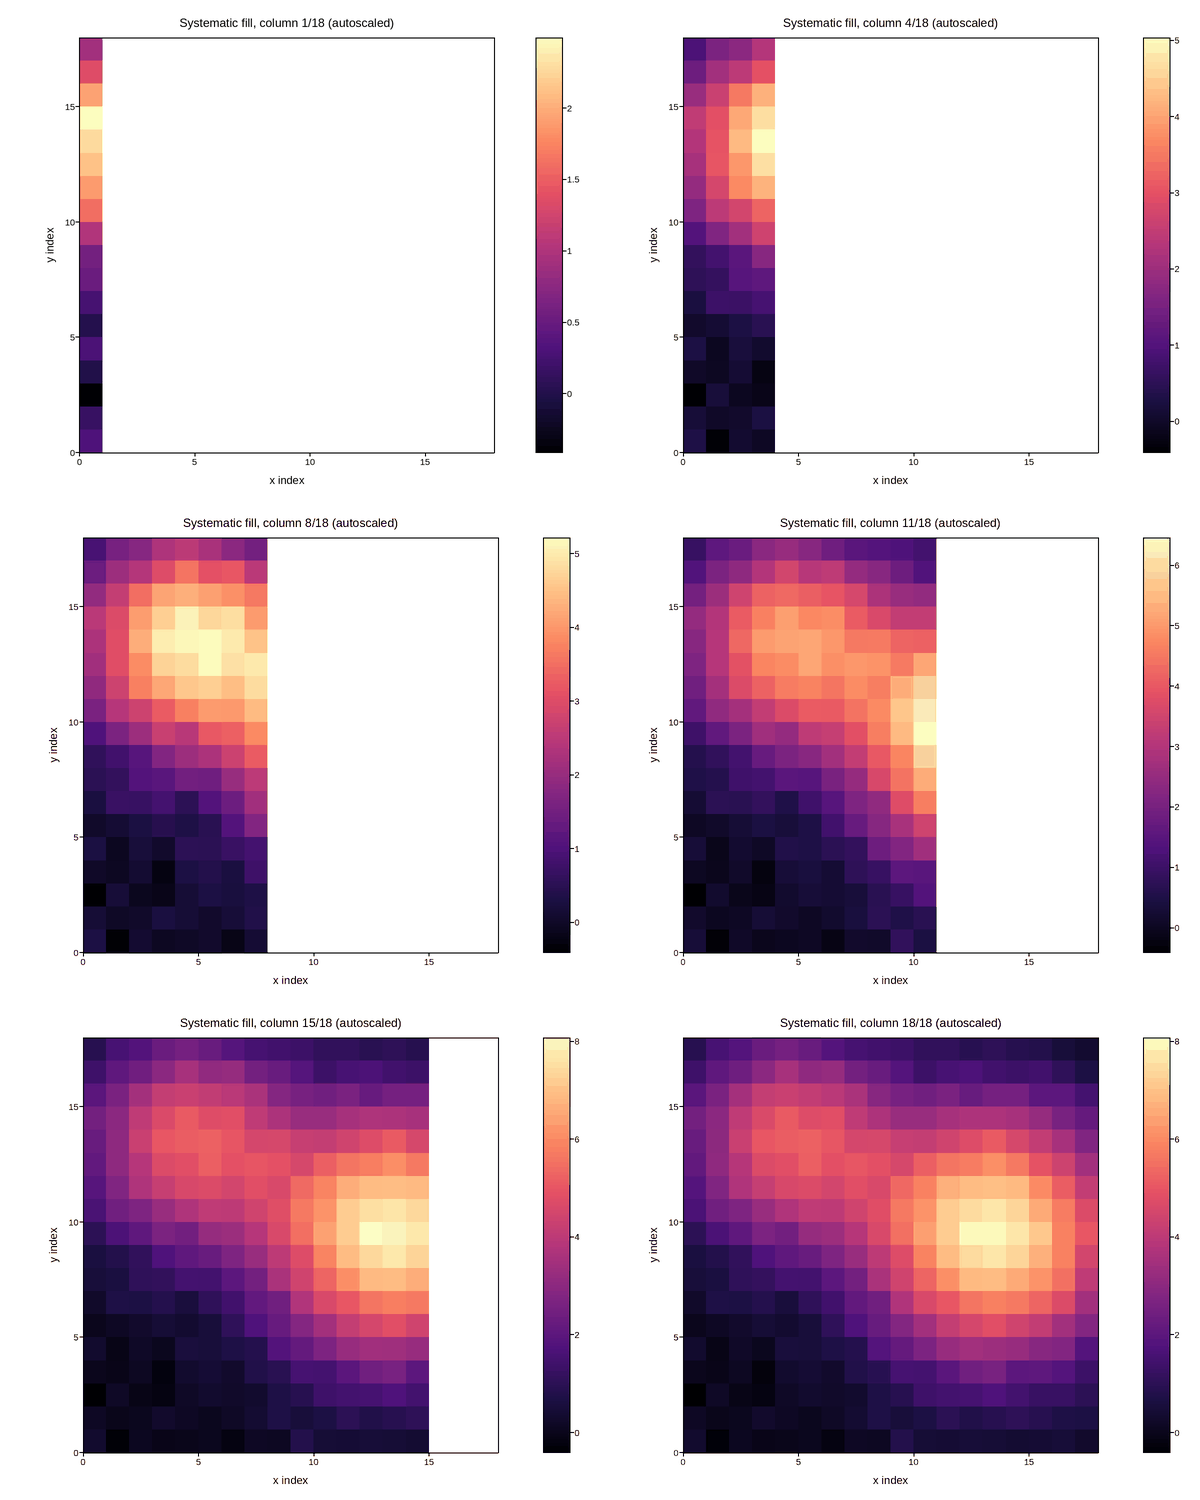
Systematic acquisition with an autoscaling colour bar
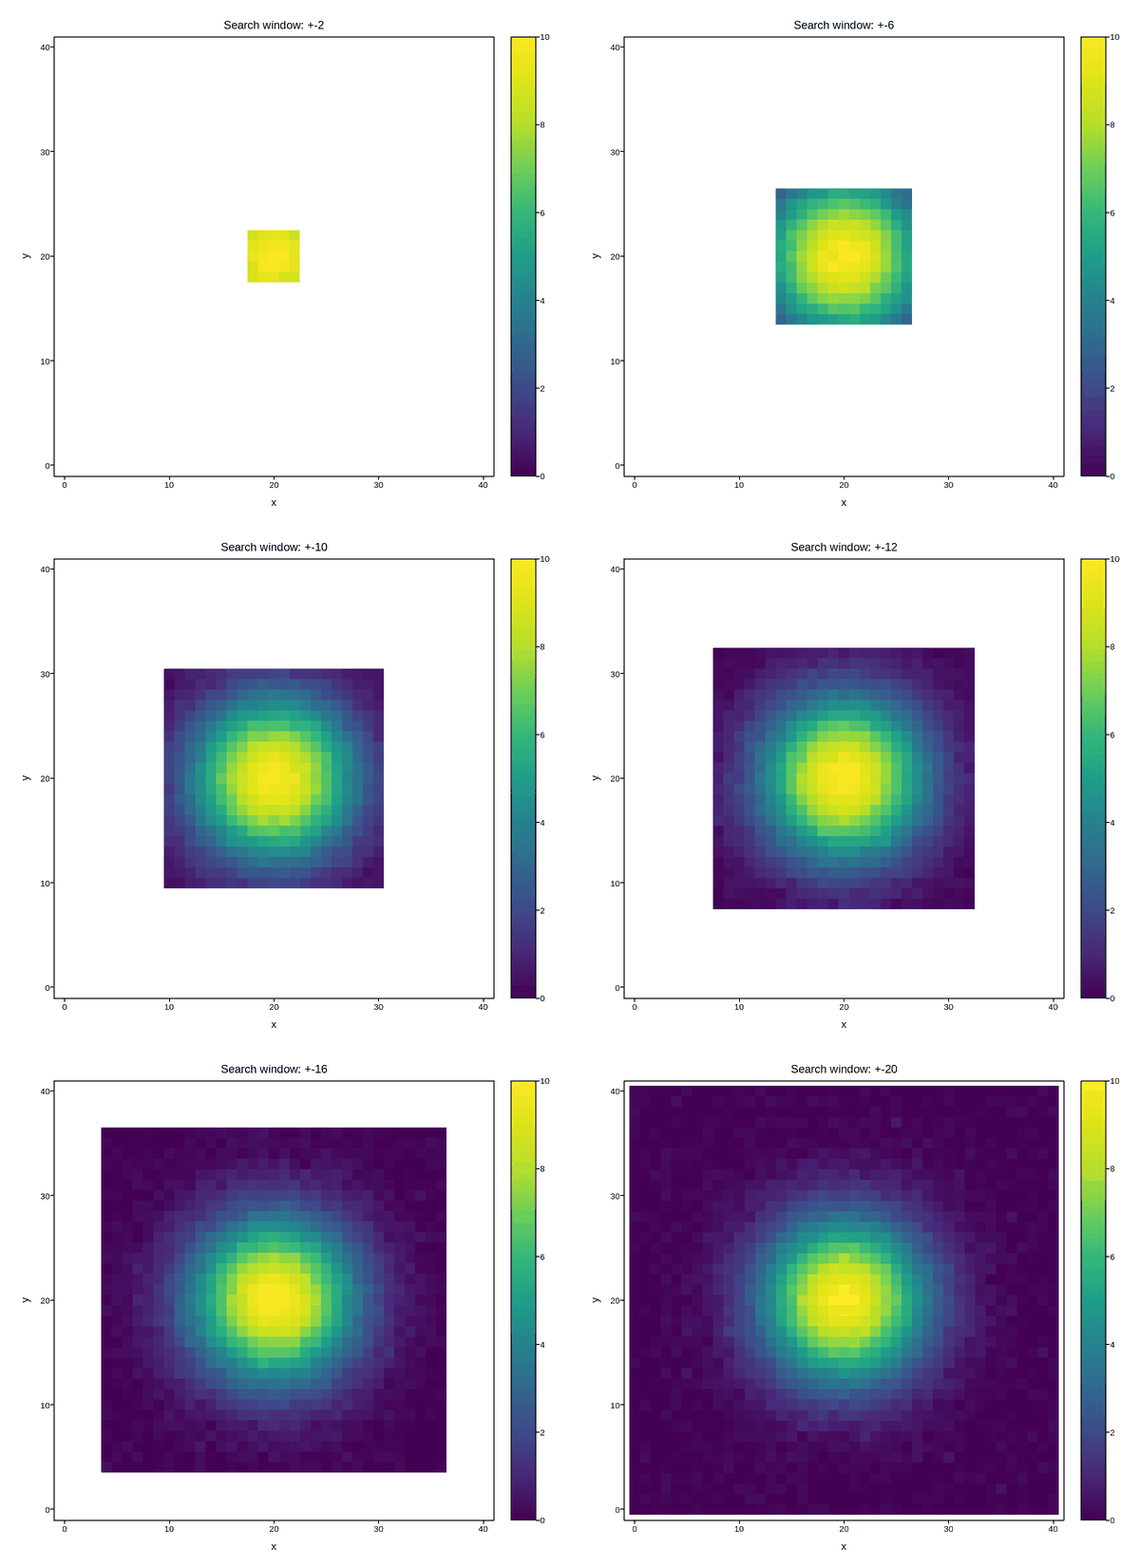
Both axes growing: a search window expanding outward
Lab instrument examples
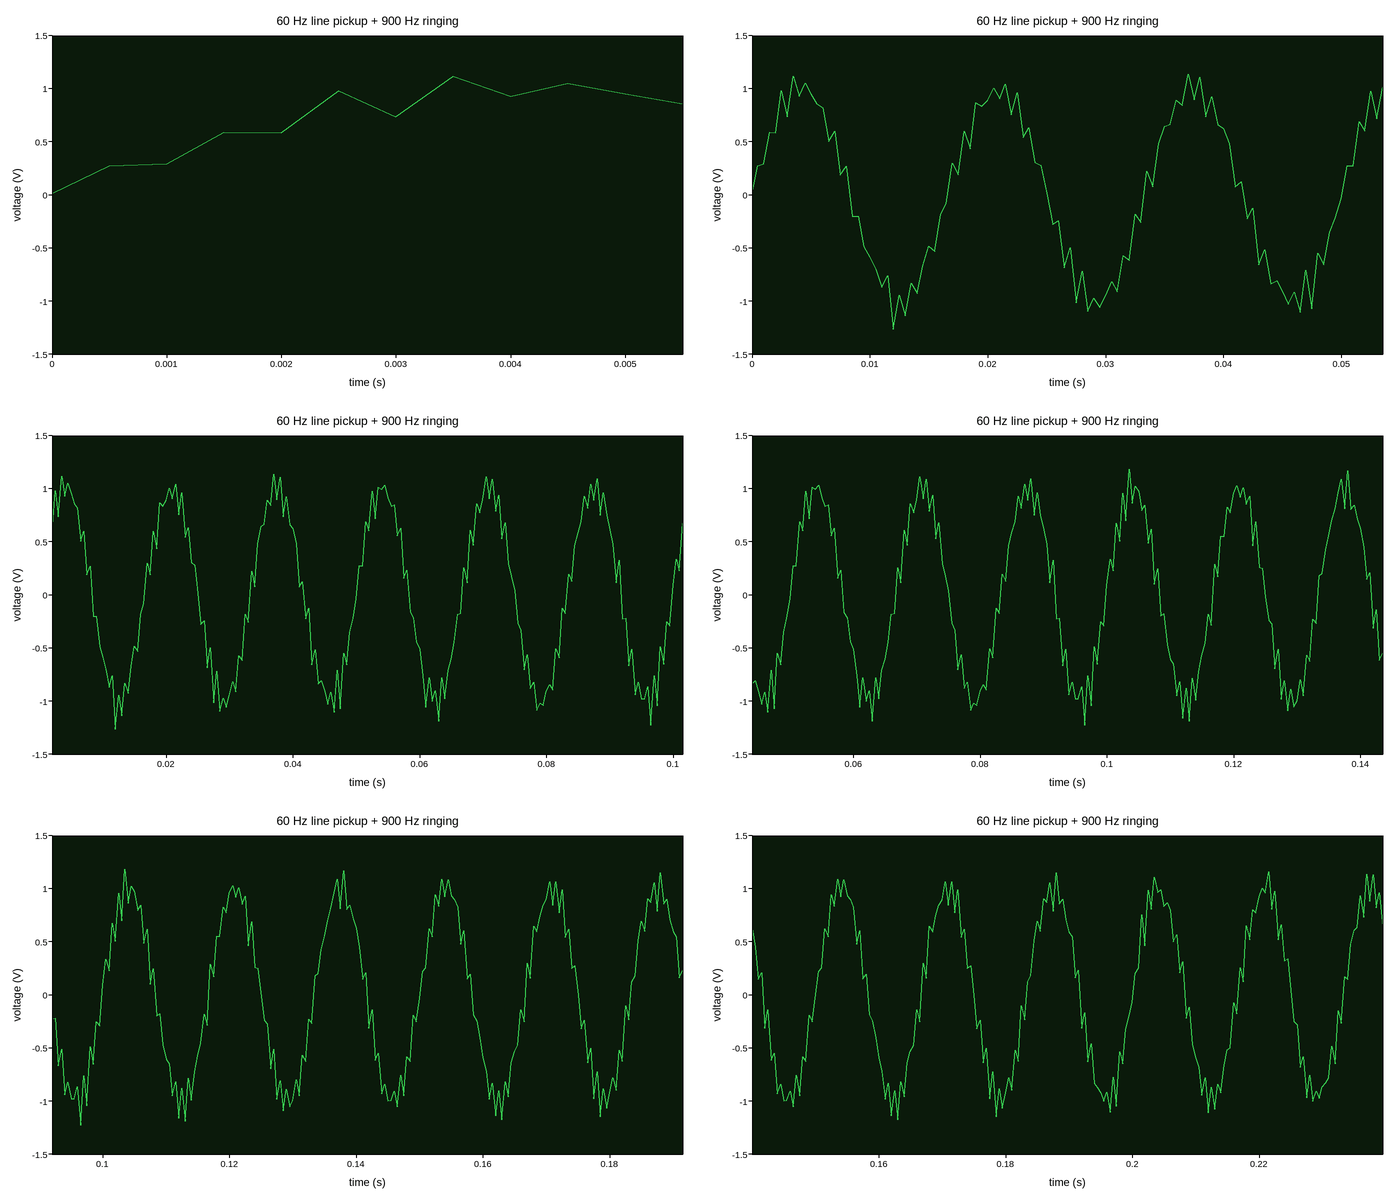
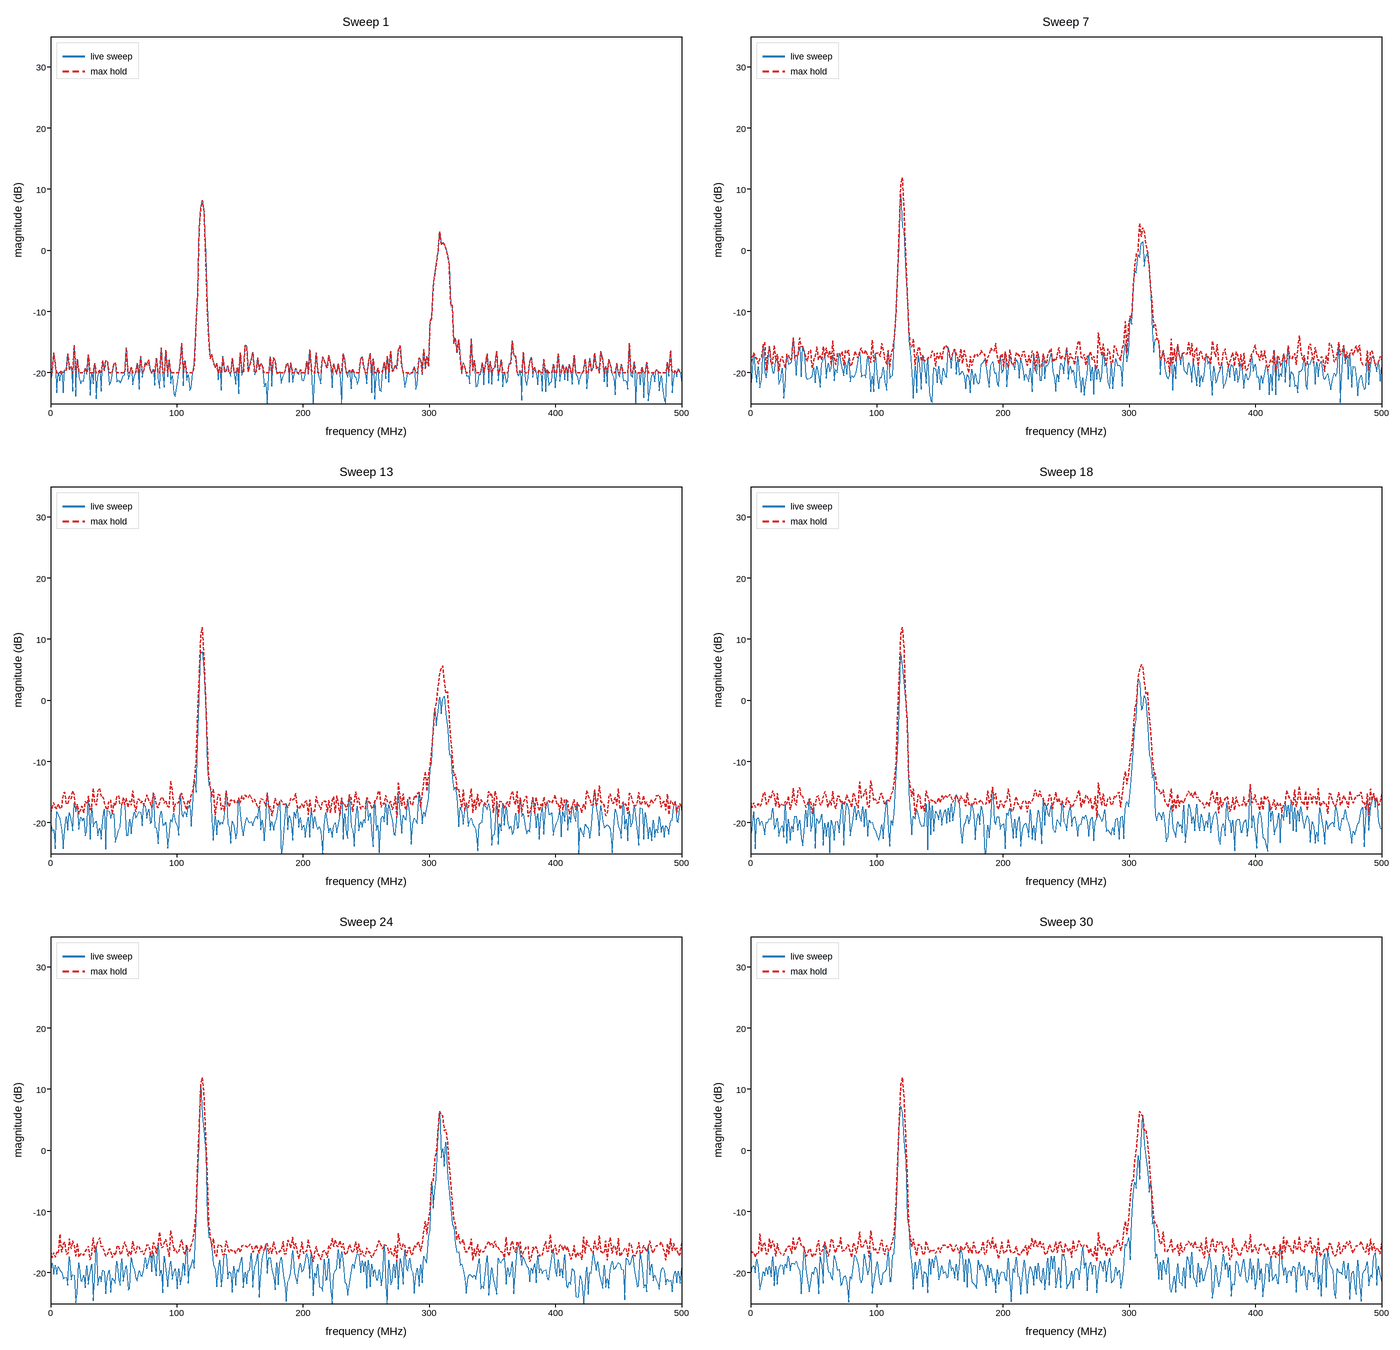
The acquisition shapes in Acquisition patterns, applied to
specific instruments a working lab actually watches update in real time –
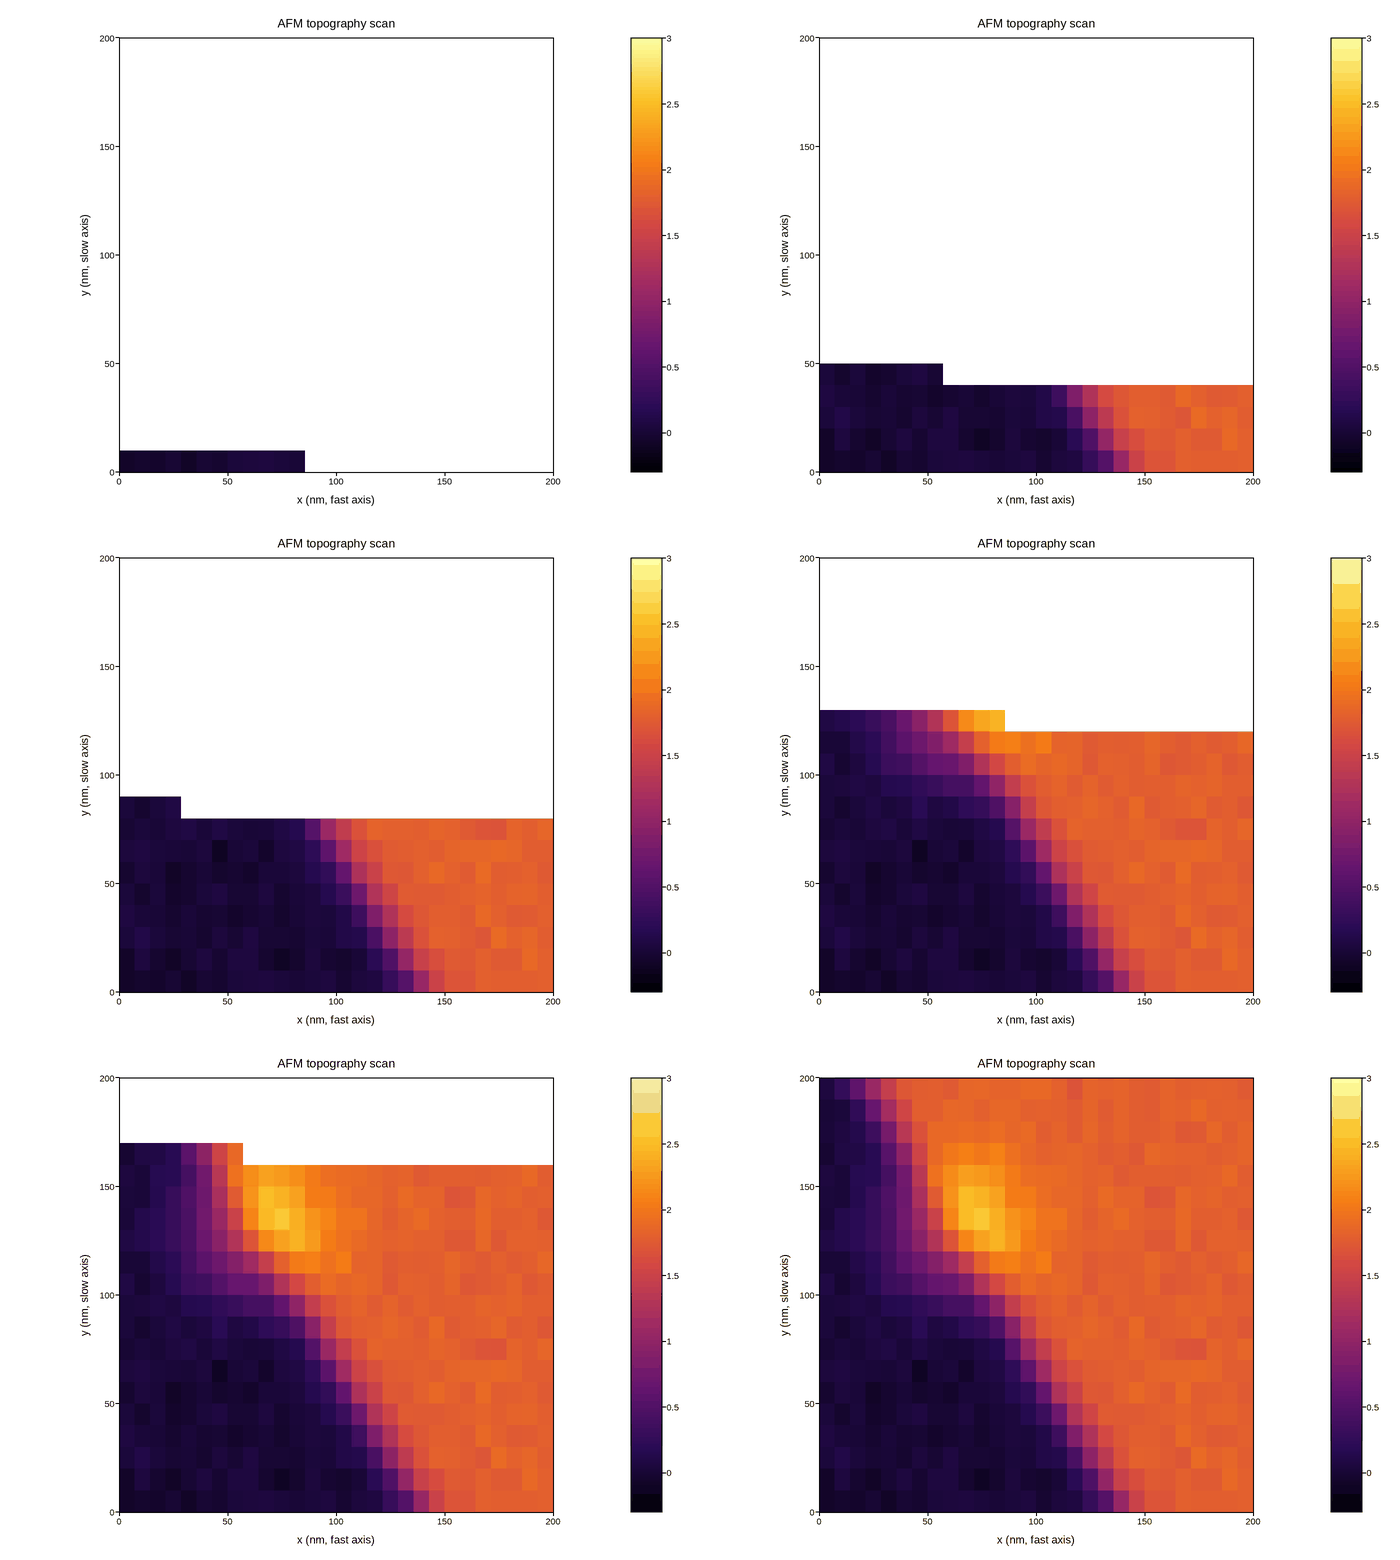
an oscilloscope’s rolling buffer, a titration’s growing curve, a raster
scanning microscope’s point-by-point image, a detector’s accumulating hit
map, two searches driven by the adaptive
package’s own sampling strategy, and more. Each is the same kind of update a
real plotpress.qt.LiveArtist would drive live; these render the sequence
as a GIF since the doc build has no Qt binding to drive a real window with.
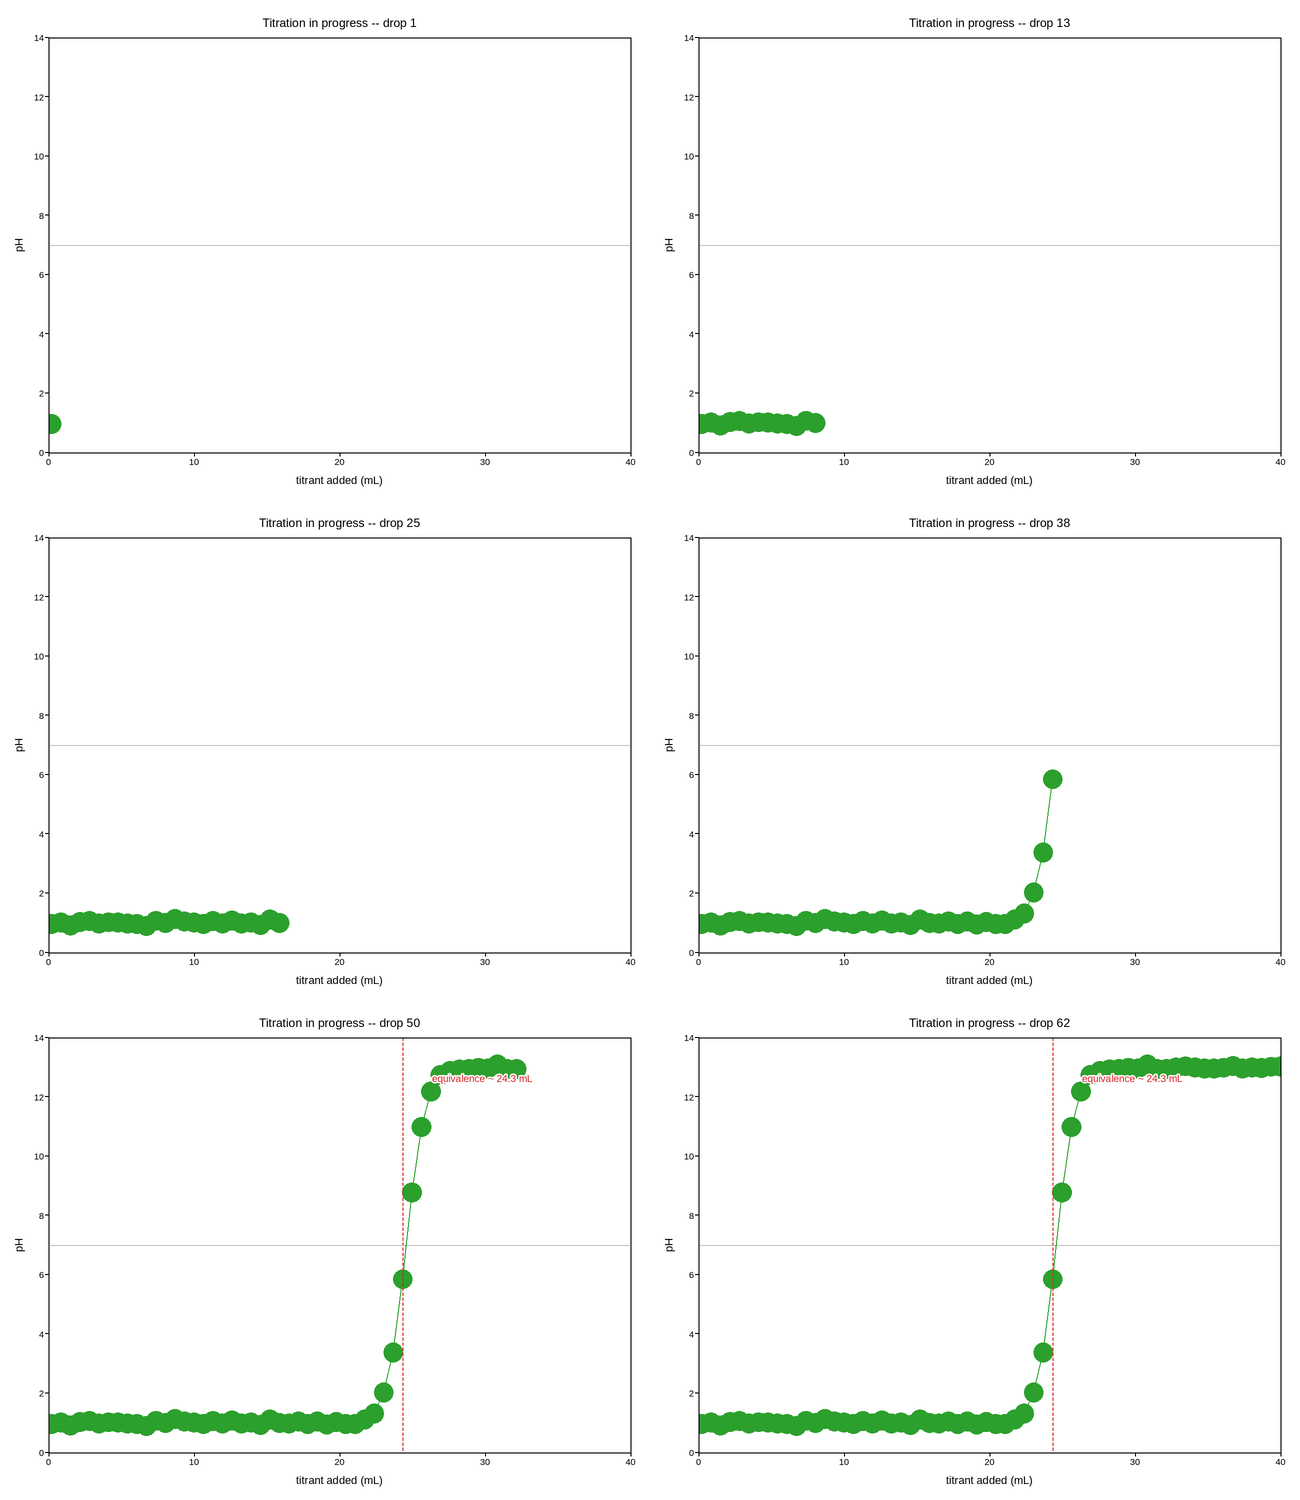
Titration curve, marking the equivalence point live
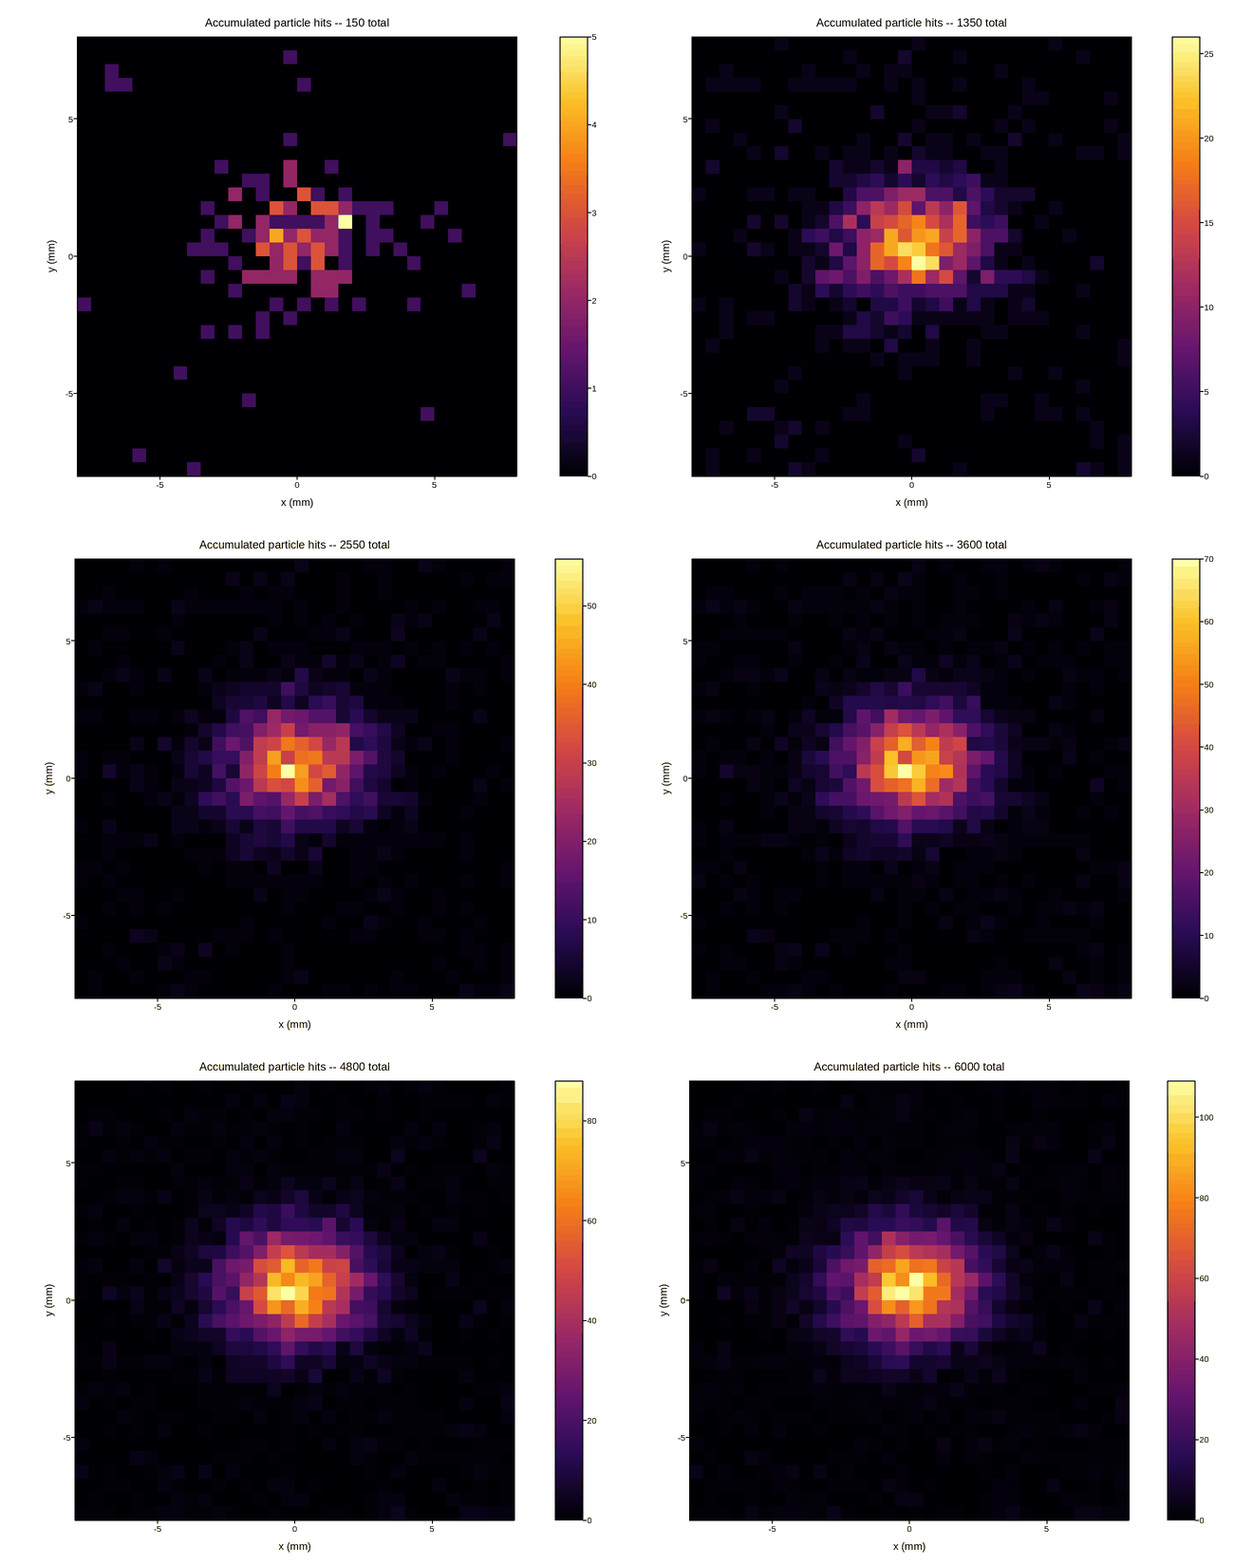
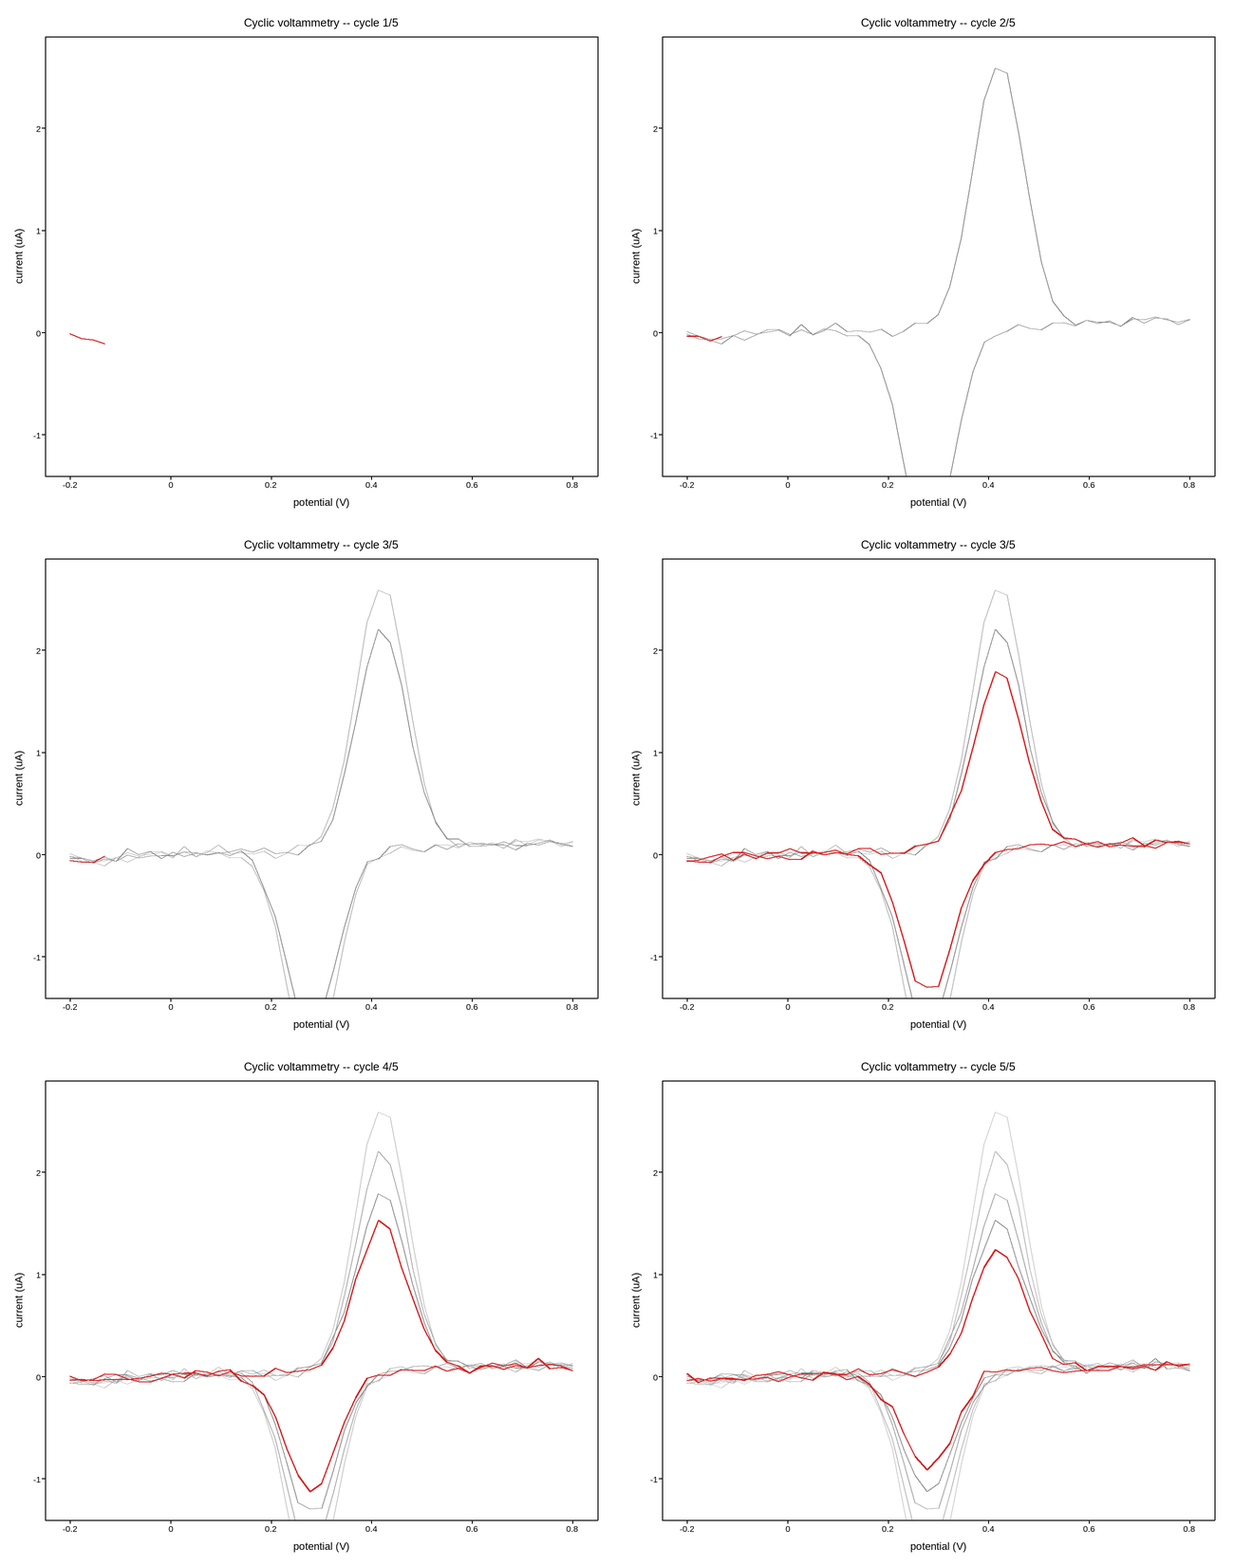
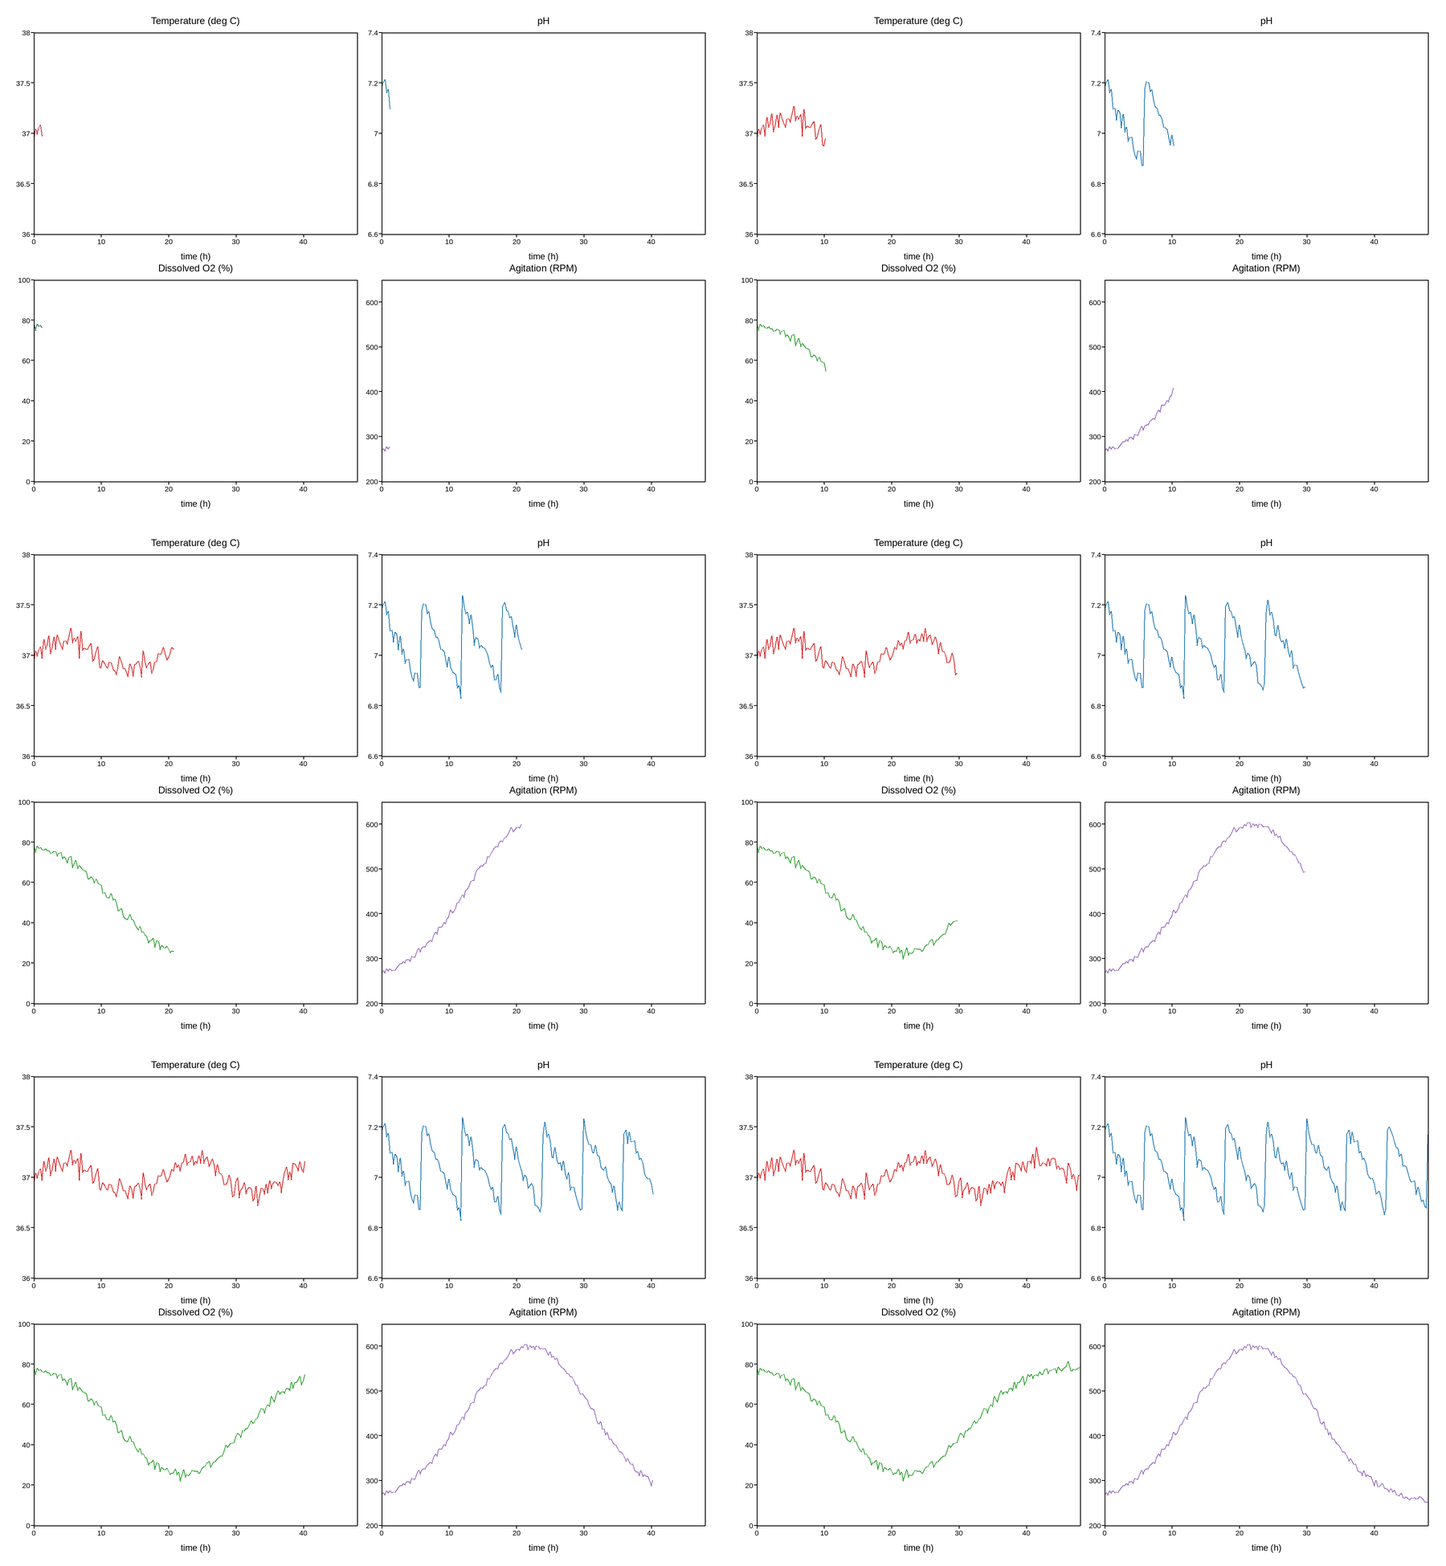
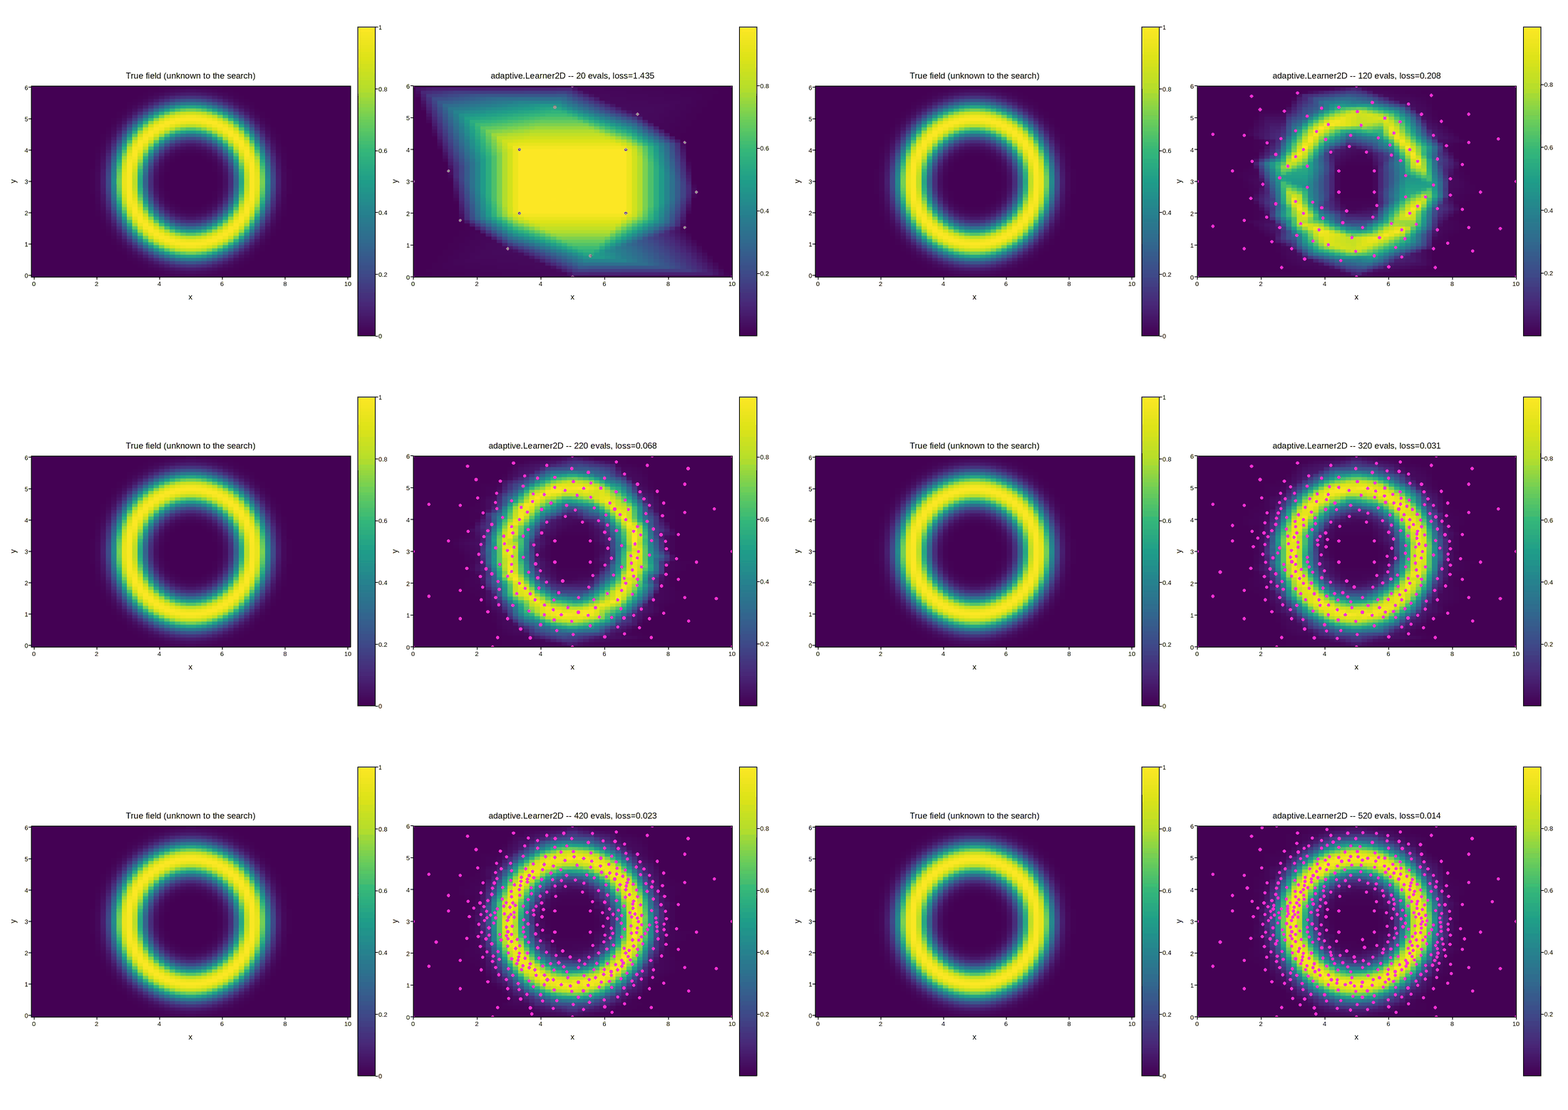
Adaptive search for a halo, with the adaptive package
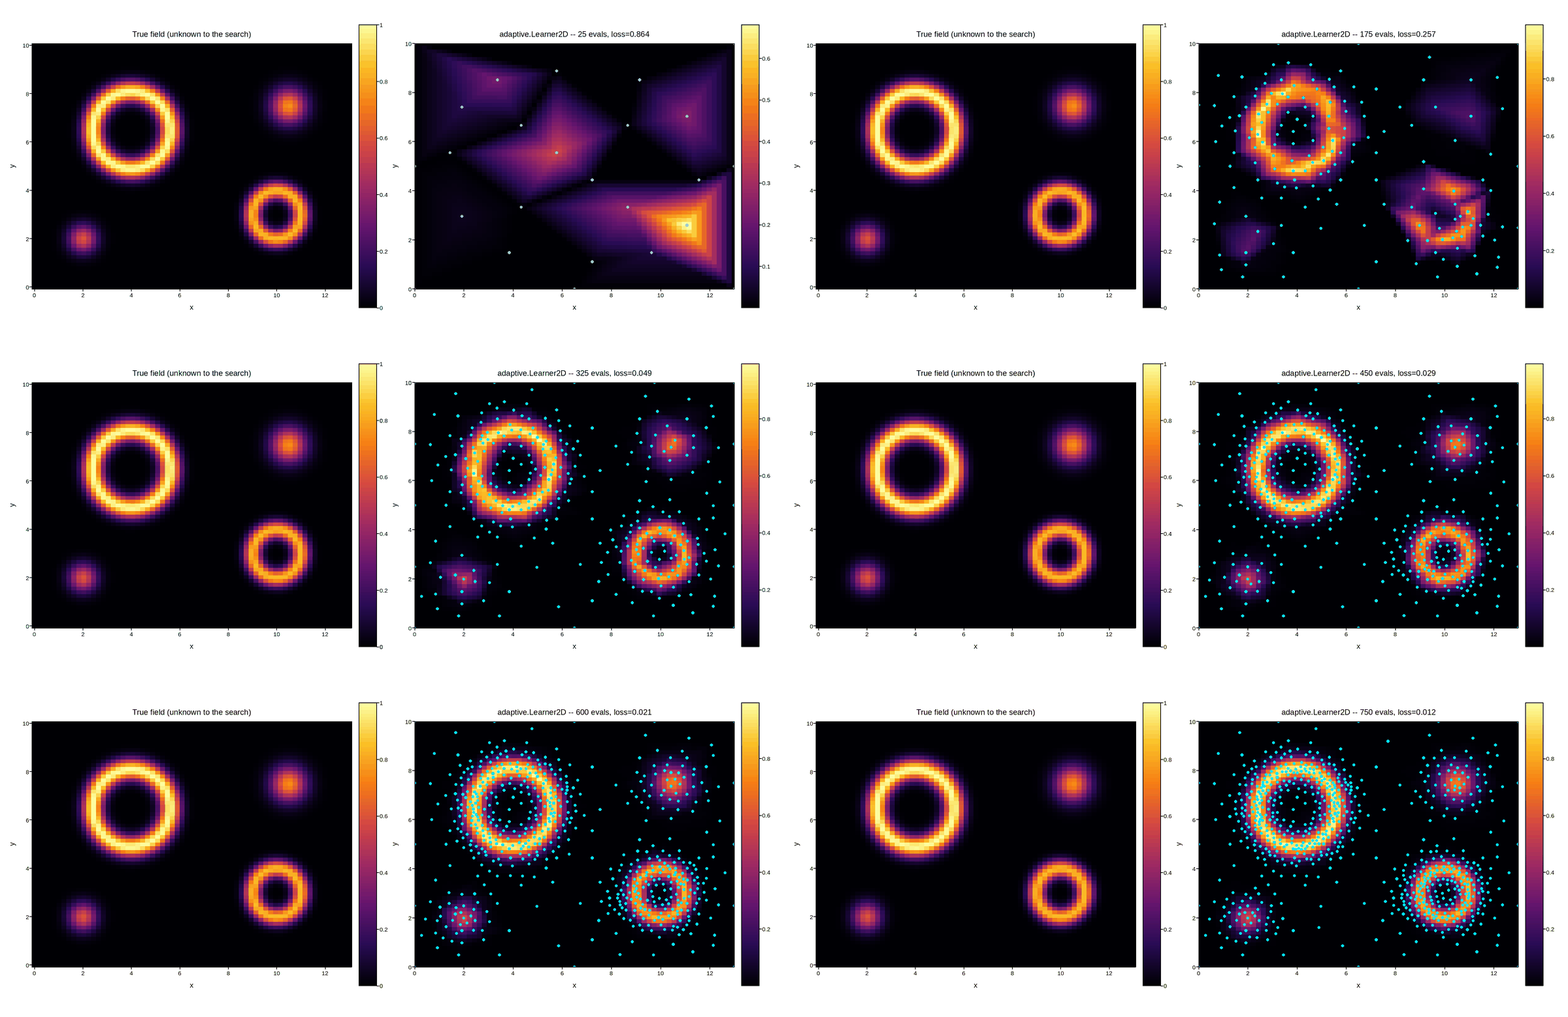
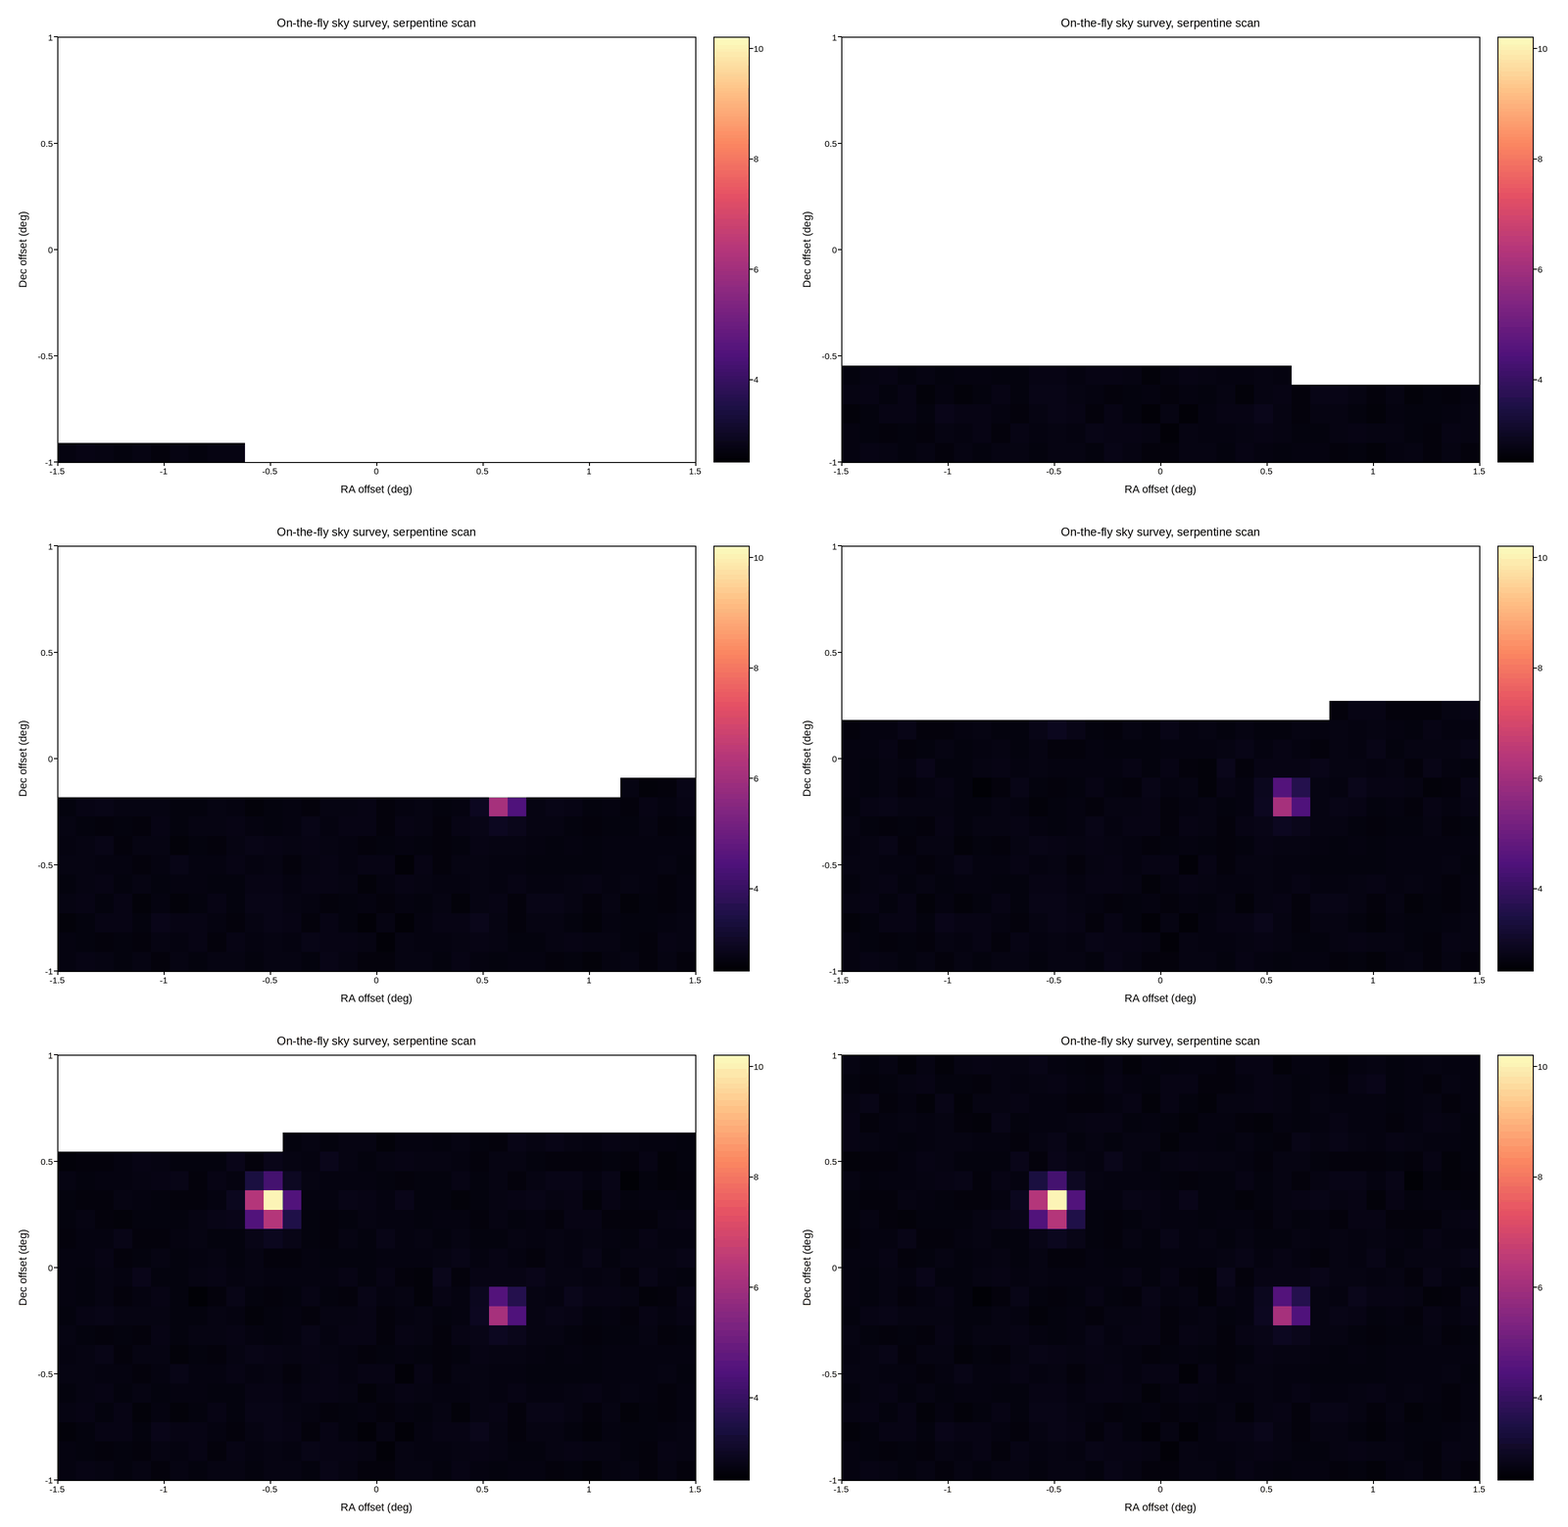
Adaptive search across several separated anomalies