Note
Go to the end to download the full example code.
What an animated slider costs: size and save time against frame count
plot_frames() and pcolormesh_frames() both embed every frame’s data
in the self-contained interactive HTML, for the same file://-and-strict-
CSP reason Interactivity costs more than the figure does gives for point-pick data –
there is nowhere else for it to live. What differs sharply between the two
is how much each frame costs, because they carry it in entirely different
forms: a line’s frame is a raw float array, small and highly compressible;
a mesh’s frame is an independent embedded PNG, the same “one image per
frame” decision How output size scales with the data already charges a static
pcolormesh for, paid again per frame here.
That difference shows up as two different growth rates, not just two different constants. The mesh curve is close to linear in frame count – each additional frame adds roughly one more compressed image, so there is no economy of scale to find. The line curve grows far more slowly, because raw coordinate arrays compress well and the fixed cost of the toolbar script dominates until the frame count is large. Save time follows the same split: mesh frames are individually rasterized, so wall-clock time tracks the size curve almost exactly, while line frames are cheap enough that most of the measured time is the fixed JSON/HTML assembly rather than the data itself.
The practical reading is in the annotated points: an 80-frame mesh animation
at a modest 120x100 resolution is already past a megabyte, where the
equivalent line animation stays under 200 KiB – worth knowing before
reaching for pcolormesh_frames() over a long sequence, and the reason a
GIF export (Interactive figures) is often the better fit
for sharing a long mesh animation instead of an interactive HTML page.
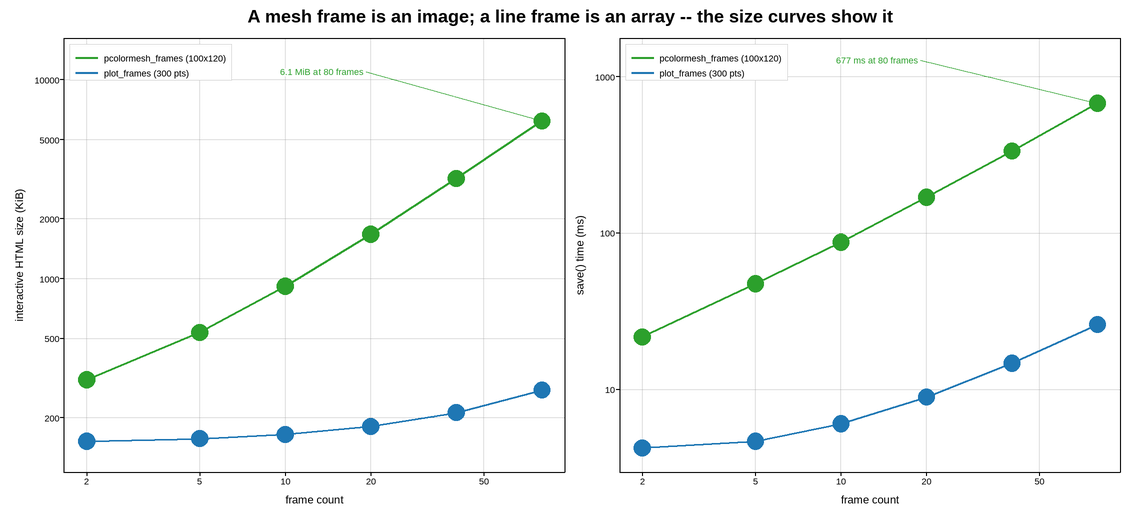
Live figure — pick a tool, then zoom, pan, point-pick or annotate. Nothing is active until a tool is selected.
import os
import tempfile
import time

import numpy as np
import plotpress

rng = np.random.default_rng(9)

FRAME_COUNTS = [2, 5, 10, 20, 40, 80]
MESH_NX, MESH_NY = 120, 100     # a representative real-application resolution
LINE_N_POINTS = 300


def mesh_cost(n_frames):
    """(KiB, ms) to save an interactive HTML animating an MESH_NY x MESH_NX mesh."""
    x, y = np.linspace(0, 1, MESH_NX), np.linspace(0, 1, MESH_NY)
    X, Y = np.meshgrid(x, y)
    phases = np.linspace(0, 6, n_frames)
    C = np.stack([np.sin(X * 6 + p) * np.cos(Y * 6)
                 + 0.05 * rng.standard_normal((MESH_NY, MESH_NX)) for p in phases])
    fig, ax = plotpress.subplots(figsize=(6.0, 4.6))
    ax.pcolormesh_frames(x, y, C)
    path = tempfile.mktemp(suffix=".html")
    t0 = time.perf_counter()
    fig.save(path, interactive=True)
    dt_ms = (time.perf_counter() - t0) * 1e3
    kib = os.path.getsize(path) / 1024.0
    os.remove(path)
    return kib, dt_ms


def line_cost(n_frames):
    """(KiB, ms) to save an interactive HTML animating an LINE_N_POINTS-point line."""
    x = np.linspace(0, 10, LINE_N_POINTS)
    phases = np.linspace(0, 6, n_frames)
    Y = np.stack([np.sin(x + p) + 0.05 * rng.standard_normal(LINE_N_POINTS)
                 for p in phases])
    fig, ax = plotpress.subplots(figsize=(6.0, 4.6))
    ax.plot_frames(x, Y)
    path = tempfile.mktemp(suffix=".html")
    t0 = time.perf_counter()
    fig.save(path, interactive=True)
    dt_ms = (time.perf_counter() - t0) * 1e3
    kib = os.path.getsize(path) / 1024.0
    os.remove(path)
    return kib, dt_ms


# A throwaway call first: font metrics and a few modules resolve lazily on
# first use, and that one-time cost would otherwise land on whichever frame
# count happens to run first rather than reflecting the frame count at all.
mesh_cost(2)
line_cost(2)

mesh_kib, mesh_ms = zip(*(mesh_cost(n) for n in FRAME_COUNTS))
line_kib, line_ms = zip(*(line_cost(n) for n in FRAME_COUNTS))

fig, (ax_size, ax_time) = plotpress.subplots(1, 2, figsize=(11.4, 5.2))

for ax, mesh_y, line_y, ylabel in [
        (ax_size, mesh_kib, line_kib, "interactive HTML size (KiB)"),
        (ax_time, mesh_ms, line_ms, "save() time (ms)")]:
    ax.plot(FRAME_COUNTS, mesh_y, color="#2ca02c", linewidth=2.0,
            label=f"pcolormesh_frames ({MESH_NY}x{MESH_NX})")
    ax.scatter(FRAME_COUNTS, mesh_y, s=12.0, color="#2ca02c")
    ax.plot(FRAME_COUNTS, line_y, color="#1f77b4", linewidth=2.0,
            label=f"plot_frames ({LINE_N_POINTS} pts)")
    ax.scatter(FRAME_COUNTS, line_y, s=12.0, color="#1f77b4")
    ax.set_xscale("log")
    ax.set_yscale("log")
    ax.set_ylim(min(min(mesh_y), min(line_y)) * 0.7,
               max(max(mesh_y), max(line_y)) * 2.6)
    ax.set_xlabel("frame count")
    ax.set_ylabel(ylabel)
    ax.legend(loc="upper left")
    ax.grid(True)

ax_size.annotate(f"{mesh_kib[-1] / 1024:.1f} MiB at {FRAME_COUNTS[-1]} frames",
                 xy=(FRAME_COUNTS[-1], mesh_kib[-1]),
                 xytext=(FRAME_COUNTS[-1] * 0.12, mesh_kib[-1] * 1.7),
                 arrowprops={"color": "#2ca02c"}, color="#2ca02c", fontsize=9)
ax_time.annotate(f"{mesh_ms[-1]:.0f} ms at {FRAME_COUNTS[-1]} frames",
                 xy=(FRAME_COUNTS[-1], mesh_ms[-1]),
                 xytext=(FRAME_COUNTS[-1] * 0.12, mesh_ms[-1] * 1.8),
                 arrowprops={"color": "#2ca02c"}, color="#2ca02c", fontsize=9)

fig.suptitle("A mesh frame is an image; a line frame is an array -- the size curves show it")
fig.tight_layout()
Total running time of the script: (0 minutes 1.727 seconds)