Note
Go to the end to download the full example code.
Interactivity costs more than the figure does
An interactive figure is self-contained: the toolbar’s JavaScript is inlined and
so is the data it needs to answer a point-pick, because the file must work from
file:// and under a strict CSP with no outside requests. That is a deliberate
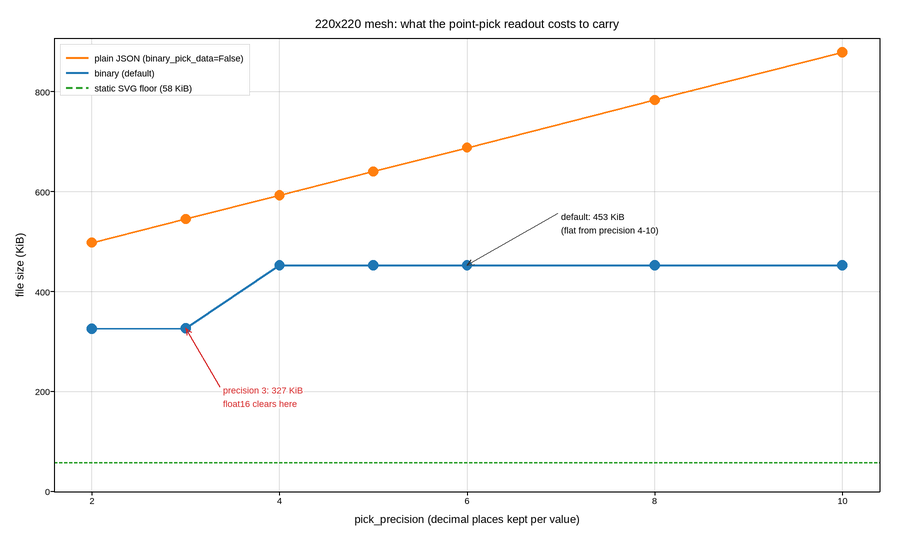
constraint and it has a price, which this figure measures: for a mesh the
inlined z grid dwarfs the drawing, and the interactive file is several times
the static one at every setting.
There is no way to have the first property without the second. Fetching the pick data on demand would make the file small and would also make it stop working from a filesystem, inside a notebook, or behind a CSP – which are the cases the format exists for.
pick_precision used to trade file size smoothly: a JSON number is text, so
dropping a digit dropped bytes. It still can (binary_pick_data=False, the
plain-JSON payload plotpress used to always emit), but the default payload
(binary_pick_data=True) inlines long arrays as base64 float32/float16 bytes
instead – a fixed 4 (or 2) bytes per value no matter how many decimals were
kept, so the curve below is flat almost everywhere pick_precision used to
matter. It only drops once precision is low enough that float16 survives the
round trip without losing anything (see plotpress.figure._fits_float16())
– a step, not a slope, and one this particular field’s value range happens to
clear only at precision 3 and below.
Two curves, then: the plain-JSON payload for the smooth, linear-in-digits-
dropped relationship pick_precision originally documented, and the binary
default it now stands next to – roughly half the plain payload’s size at the
library’s own default precision, without touching pick_precision at all.
Live figure — pick a tool, then zoom, pan, point-pick or annotate. Nothing is active until a tool is selected.
import time

import numpy as np
import plotpress

rng = np.random.default_rng(5)

N = 220
g = np.linspace(-3.0, 3.0, N)
X, Y = np.meshgrid(g, g)
Z = np.sin(X * 1.7) * np.cos(Y * 1.3) + 0.3 * rng.random((N, N))


def payload(precision, binary_pick_data):
    """KiB of self-contained interactive HTML at this pick precision."""
    f, a = plotpress.subplots(figsize=(6.0, 5.0))
    a.pcolormesh(g, g, Z, cmap="viridis")
    html = f.to_html(interactive=True, pick_precision=precision,
                     binary_pick_data=binary_pick_data)
    return len(html.encode("utf-8")) / 1024.0


precisions = [2, 3, 4, 5, 6, 8, 10]
binary_sizes = [payload(p, True) for p in precisions]
plain_sizes = [payload(p, False) for p in precisions]

def static_floor():
    """KiB of plain SVG -- everything above this is the price of interaction.

    Built inside a function so its Figure stays local: the gallery scraper
    collects every Figure left in an example's globals, and a scratch one would
    be published as a second, meaningless image on the page.
    """
    f, a = plotpress.subplots(figsize=(6.0, 5.0))
    a.pcolormesh(g, g, Z, cmap="viridis")
    return len(f.to_svg().encode("utf-8")) / 1024.0


static_kib = static_floor()

fig, ax = plotpress.subplots(figsize=(9.0, 5.4))
ax.plot(precisions, plain_sizes, color="#ff7f0e", linewidth=2.0,
        label="plain JSON (binary_pick_data=False)")
ax.scatter(precisions, plain_sizes, s=7.0, color="#ff7f0e")
ax.plot(precisions, binary_sizes, color="#1f77b4", linewidth=2.0,
        label="binary (default)")
ax.scatter(precisions, binary_sizes, s=7.0, color="#1f77b4")
ax.axhline(static_kib, color="#2ca02c", linestyle="--", linewidth=1.6,
           label=f"static SVG floor ({static_kib:.0f} KiB)")

DEFAULT = 6
default_kib = binary_sizes[precisions.index(DEFAULT)]
ax.annotate(f"default: {default_kib:.0f} KiB\n(flat from precision 4-10)",
            xy=(DEFAULT, default_kib), xytext=(7.0, default_kib * 1.2),
            arrowprops={"color": "#333333"}, fontsize=9)
step_kib = binary_sizes[precisions.index(3)]
ax.annotate(f"precision 3: {step_kib:.0f} KiB\nfloat16 clears here",
            xy=(3, step_kib), xytext=(3.4, step_kib * 0.6),
            arrowprops={"color": "#d62728"}, color="#d62728", fontsize=9)

ax.set_xlabel("pick_precision (decimal places kept per value)")
ax.set_ylabel("file size (KiB)")
ax.set_ylim(0.0, None)
ax.set_title(f"{N}x{N} mesh: what the point-pick readout costs to carry")
ax.legend(loc="upper left")
ax.grid(True)
fig.tight_layout()
Total running time of the script: (0 minutes 0.771 seconds)