Note
Go to the end to download the full example code.
Scatter does not scale, and cannot be made to
Every other plot type in this gallery has something that flattens its cost. A line is decimated to the pixel column. A mesh becomes one image. Scatter has nothing, and the reason is not an implementation gap: each point is an independent mark, and dropping one destroys information about density, which is the only thing a scatter this size is carrying. There is no lossless simplification of the rendered result to fall back on.
So the constant is all that can be improved, and it is: the whole collection is
one <path> of zero-length round-capped strokes instead of 500,000
<circle> elements. That is several hundred thousand fewer nodes, and it is
also what keeps markers a constant size under the interactive zoom, since a
stroke width can be declared non-scaling where a circle radius cannot. But the
slope stays at one: double the points, double the file. At half a million the
SVG is measured in megabytes, and no keyword argument changes that.
The right panel is the actual answer, and the reason this example sits under
limitations rather than above it. At this density the scatter has stopped being
readable as a scatter – the core saturates and the distribution is
unrecoverable – so the points are binned instead. The left panel is what the
library can do; the right is what you should do. Above roughly ten thousand
points, prefer hexbin or hist2d.
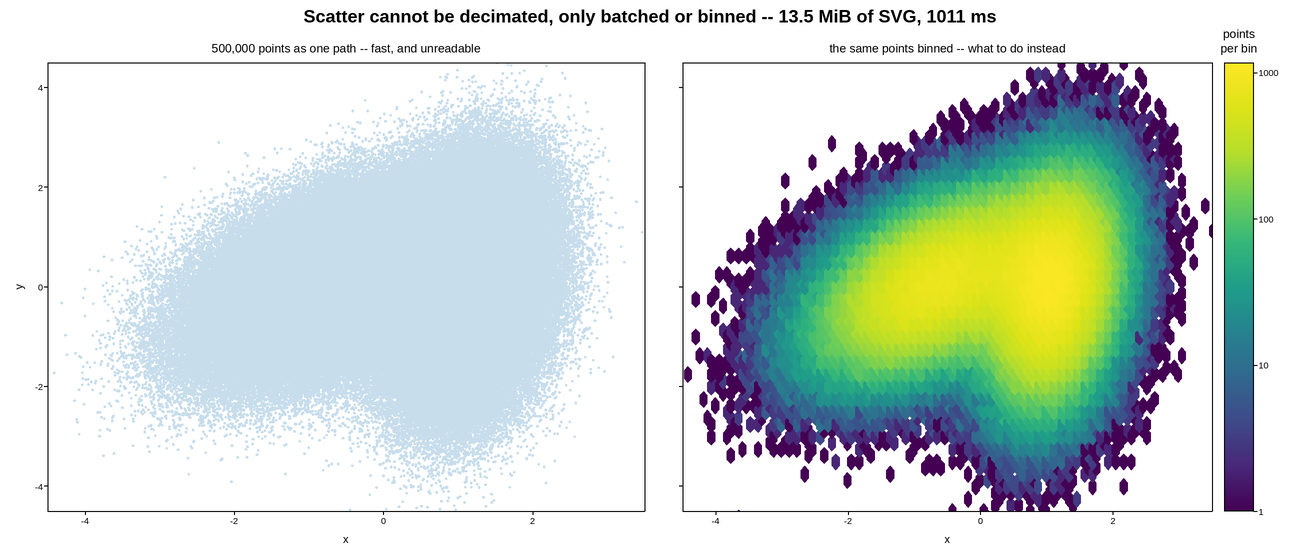
Live figure — pick a tool, then zoom, pan, point-pick or annotate. Nothing is active until a tool is selected.
import time

import numpy as np
import plotpress

rng = np.random.default_rng(7)

N = 500_000
# Two overlapping populations, so density is the interesting quantity.
x = np.concatenate([rng.normal(-0.6, 0.9, N // 2), rng.normal(1.1, 0.5, N // 2)])
y = np.concatenate([rng.normal(0.4, 0.8, N // 2), rng.normal(-0.5, 1.1, N // 2)])
y += 0.45 * x                                   # correlate them

t0 = time.perf_counter()
fig, axes = plotpress.subplots(1, 2, figsize=(13.0, 5.6), sharex=True, sharey=True)
ax_pts, ax_hex = axes

ax_pts.scatter(x, y, s=1.6, color="#1f77b4", alpha=0.25)
ax_pts.set_xlabel("x")
ax_pts.set_ylabel("y")
ax_pts.set_title(f"{N:,} points as one path -- fast, and unreadable")

hb = ax_hex.hexbin(x, y, gridsize=70, cmap="viridis", mincnt=1,
                   norm=plotpress.LogNorm())
fig.colorbar(hb, ax=ax_hex).set_title("points\nper bin")
ax_hex.set_xlabel("x")
ax_hex.set_title("the same points binned -- what to do instead")

ax_pts.set_xlim(-4.5, 3.5)
ax_pts.set_ylim(-4.5, 4.5)
fig.tight_layout()
build_ms = (time.perf_counter() - t0) * 1e3

svg = fig.to_svg()
fig.suptitle(f"Scatter cannot be decimated, only batched or binned -- "
             f"{len(svg) / 1024 / 1024:.1f} MiB of SVG, {build_ms:.0f} ms")
Total running time of the script: (0 minutes 7.590 seconds)