Note
Go to the end to download the full example code.
500 pcolormesh plots with a shared colorbar
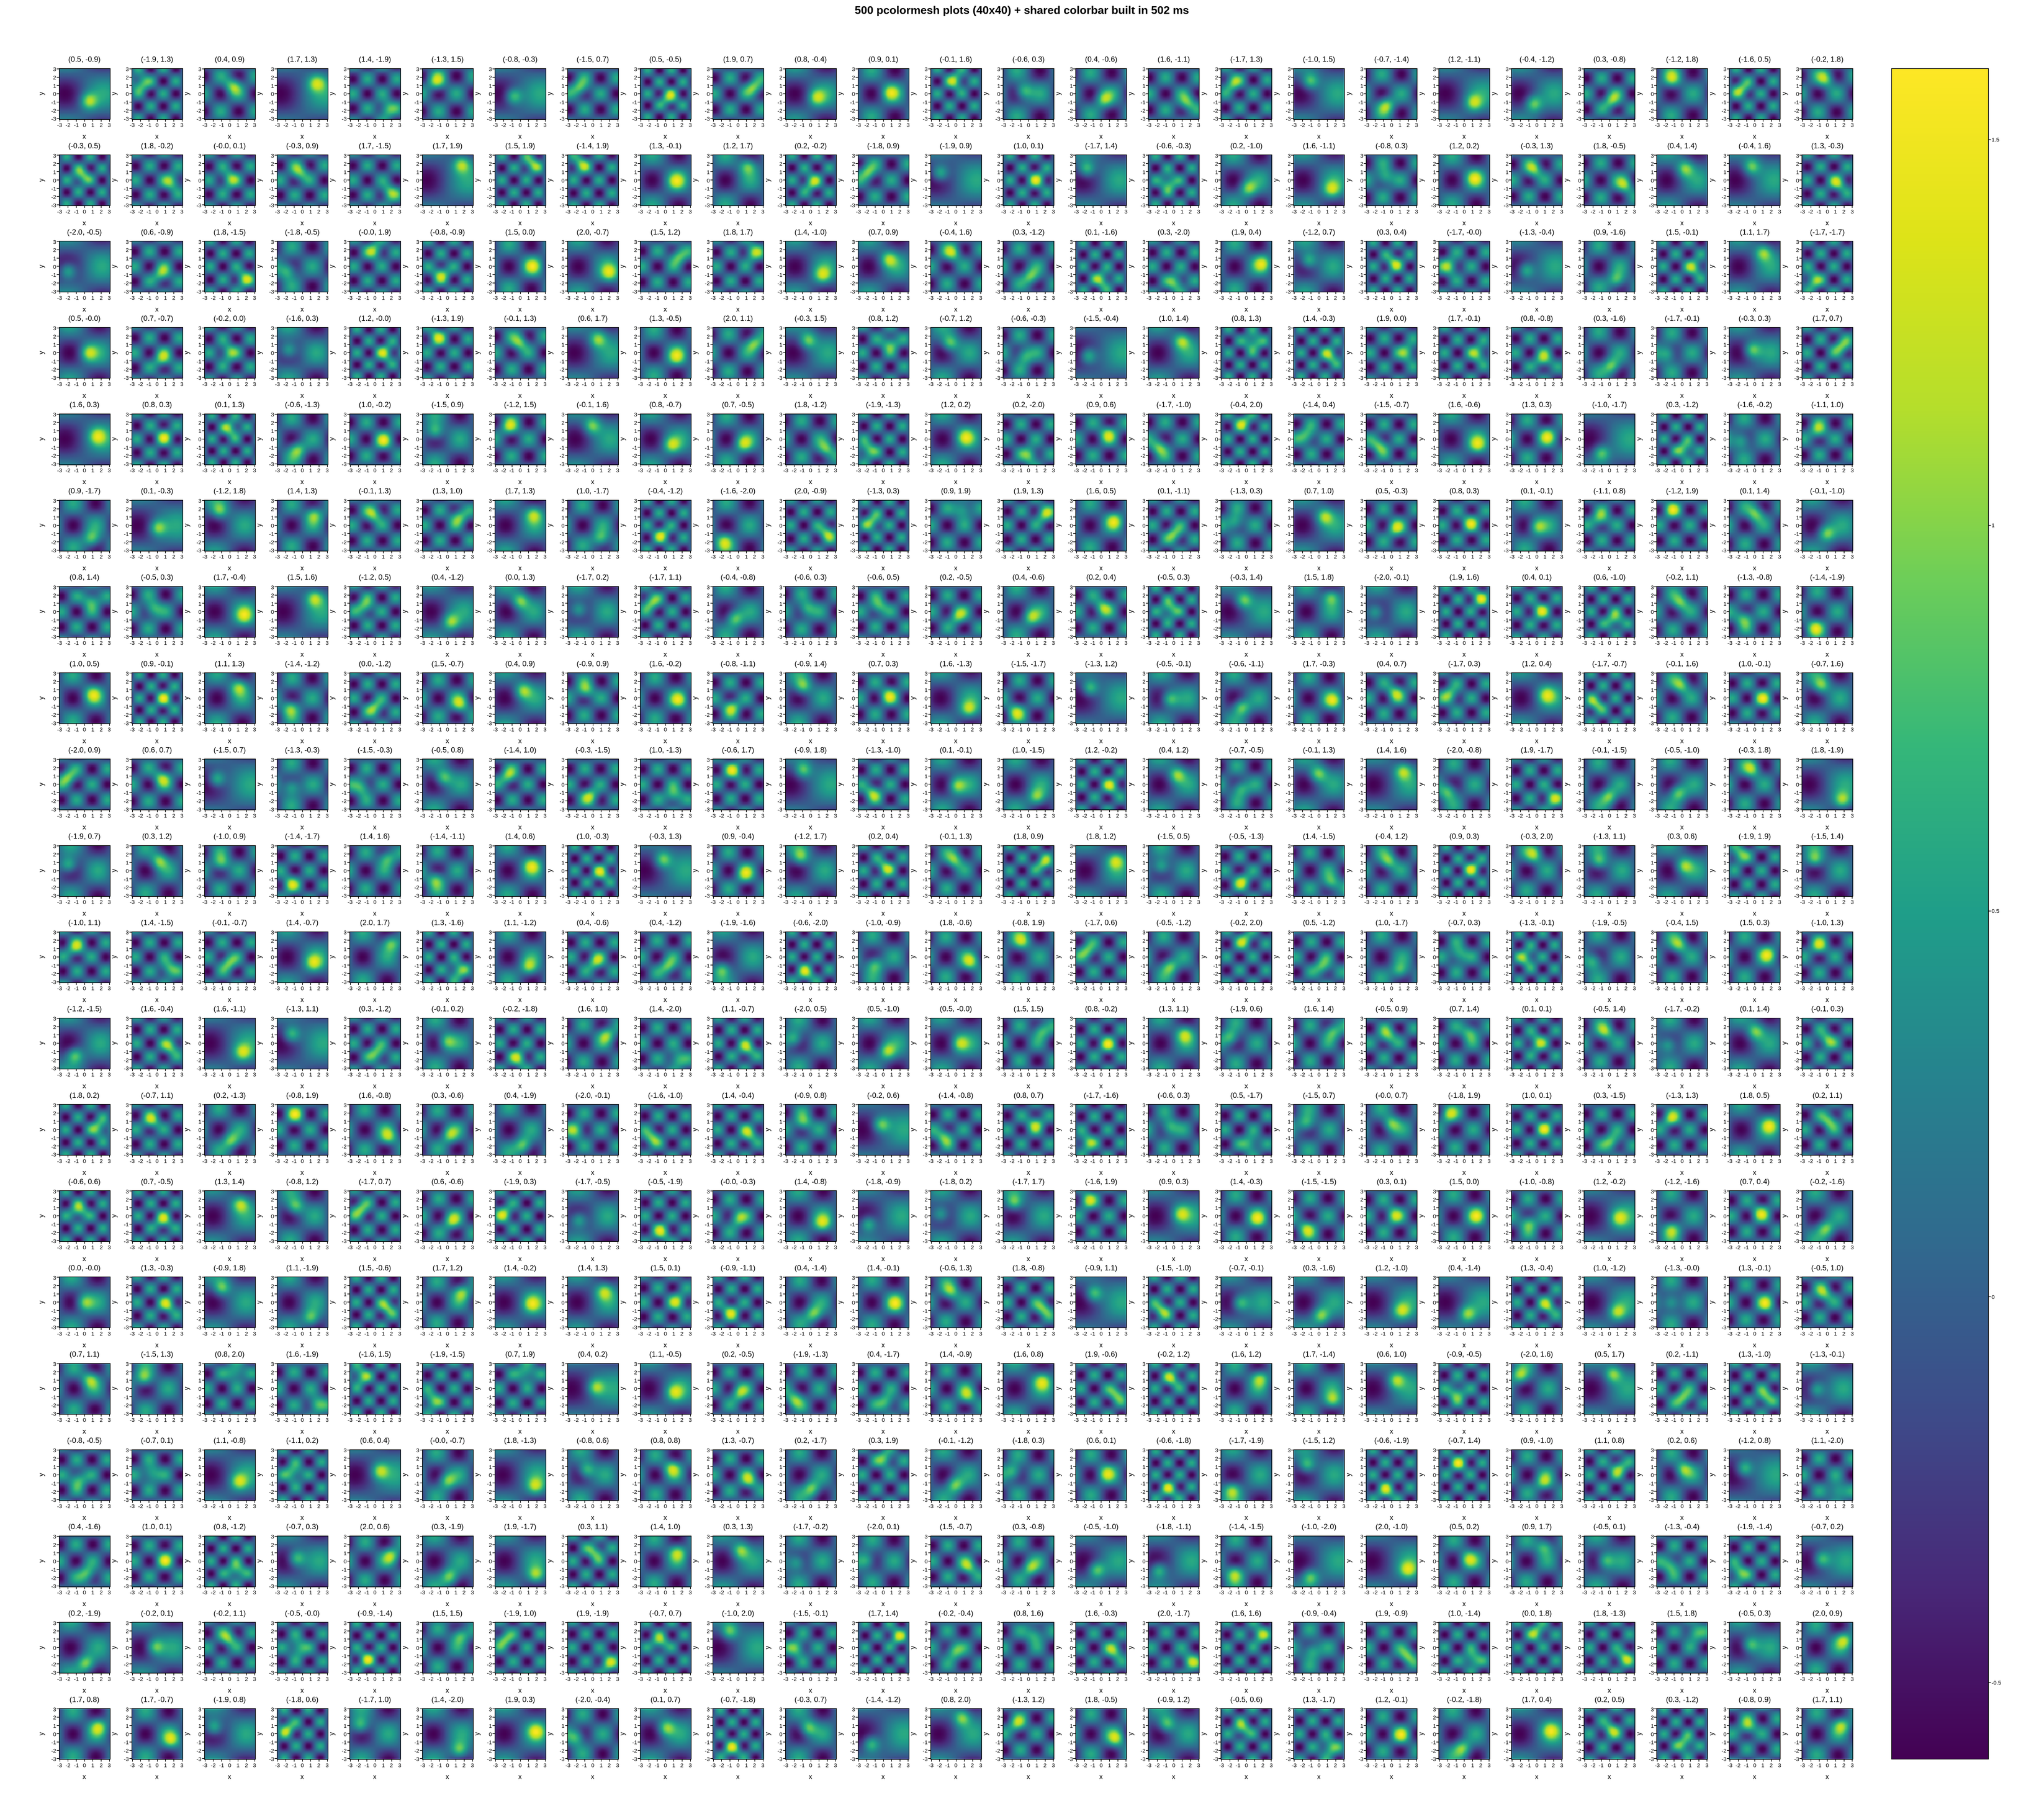
The same viridis pcolormesh as the single-plot example – but 500 of them
on a single figure (a 20x25 grid), each an independent axes with its own
40x40 field, its own title, and its own x/y axis labels and ticks. That is
500 * 40 * 40 = 800,000 mesh cells.
Because every field is drawn against the same vmin/vmax, one shared
colorbar on the right describes all 500 plots at once.
This is the “many axes on one figure” case plotpress is built for. Every mesh
is rasterized to a single embedded <image> (not thousands of vector rects),
there is no global state, and there is no per-artist Python overhead – so
building all 500 plots, their labels, and the shared colorbar takes only a
couple of hundred milliseconds. The elapsed build time is stamped into the
figure title below.
This figure has 500 panels — too many to usefully embed at a fixed size.
Open the full interactive example in a new page to pick a tool, then zoom, pan, point-pick or annotate any panel.
import time

import numpy as np
import plotpress

NROWS, NCOLS = 20, 25          # 500 plots
NY = NX = 40                   # 40x40 mesh per plot

# One shared coordinate grid; each plot gets a *different* field.
g = np.linspace(-3, 3, NX)
X, Y = np.meshgrid(g, g)       # shape (40, 40)
rng = np.random.default_rng(0)

# Pass 1: build every field first so we can pick a *shared* color range. Keep
# each field's Gaussian center so every plot can carry its own descriptive title.
fields, centers = [], []
for _ in range(NROWS * NCOLS):
    cx, cy = rng.uniform(-2.0, 2.0, size=2)
    freq = rng.uniform(0.6, 2.2)
    Z = (np.exp(-((X - cx) ** 2 + (Y - cy) ** 2))
         + 0.6 * np.sin(freq * X) * np.cos(freq * Y))
    fields.append(Z)
    centers.append((cx, cy))
vmin = min(Z.min() for Z in fields)
vmax = max(Z.max() for Z in fields)

# Pass 2: one axes per field, each fully labelled, all on the shared norm.
t0 = time.perf_counter()
# subplot_size= states what matters here -- a panel big enough to read -- and
# lets figsize follow, instead of guessing a total and finding out afterwards
# what 500 sets of ticks and titles left each panel.
fig, axes = plotpress.subplots(NROWS, NCOLS, subplot_size=(0.82, 0.82))
flat = axes.ravel()
mesh = None
for ax, Z, (cx, cy) in zip(flat, fields, centers):
    mesh = ax.pcolormesh(g, g, Z, cmap="viridis", vmin=vmin, vmax=vmax)
    ax.set_title(f"({cx:.1f}, {cy:.1f})")   # its own title: this field's center
    ax.set_xlabel("x")
    ax.set_ylabel("y")
fig.tight_layout()

# One shared colorbar spanning the whole grid on the right. Because every mesh
# uses the same vmin/vmax, a single bar describes all 500 plots; pass the list
# of axes and plotpress squeezes the grid and places one tall colorbar.
fig.colorbar(mesh, ax=flat)

build_ms = (time.perf_counter() - t0) * 1e3
fig.suptitle(f"500 pcolormesh plots (40x40) + shared colorbar "
             f"built in {build_ms:.0f} ms")
Total running time of the script: (0 minutes 8.220 seconds)