Note
Go to the end to download the full example code.
Systematic acquisition with an autoscaling colour bar
A raster scan collects a whole column at a time, stepping across x –
more orderly than the sparse case, but its colour scale can’t be fixed up
front the way Sparse, randomly-ordered acquisition’s could: with only a handful of
values in, one noisy point can dominate the range. Autoscaling the colour
bar to whatever has been measured so far keeps the plot readable at every
stage, at the cost of a scale that shifts as new extremes come in – and a
cost specific to autoscaling live: the colour bar itself has to be dropped
and redrawn every update, since it renders from a fixed snapshot of
whatever mappable it was handed, not a live reference to the axes’ current
one. LiveArtist.last_artist is exactly that snapshot – see
Viewing figures.
The code below is exactly what you’d write against the real
plotpress.qt.LiveArtist: a callback that receives one finished column at
a time and pushes it to the plot, fed by a loop simulating a raster scan
controller. Only read_next_column() is meant to be replaced, with your
own instrument call.
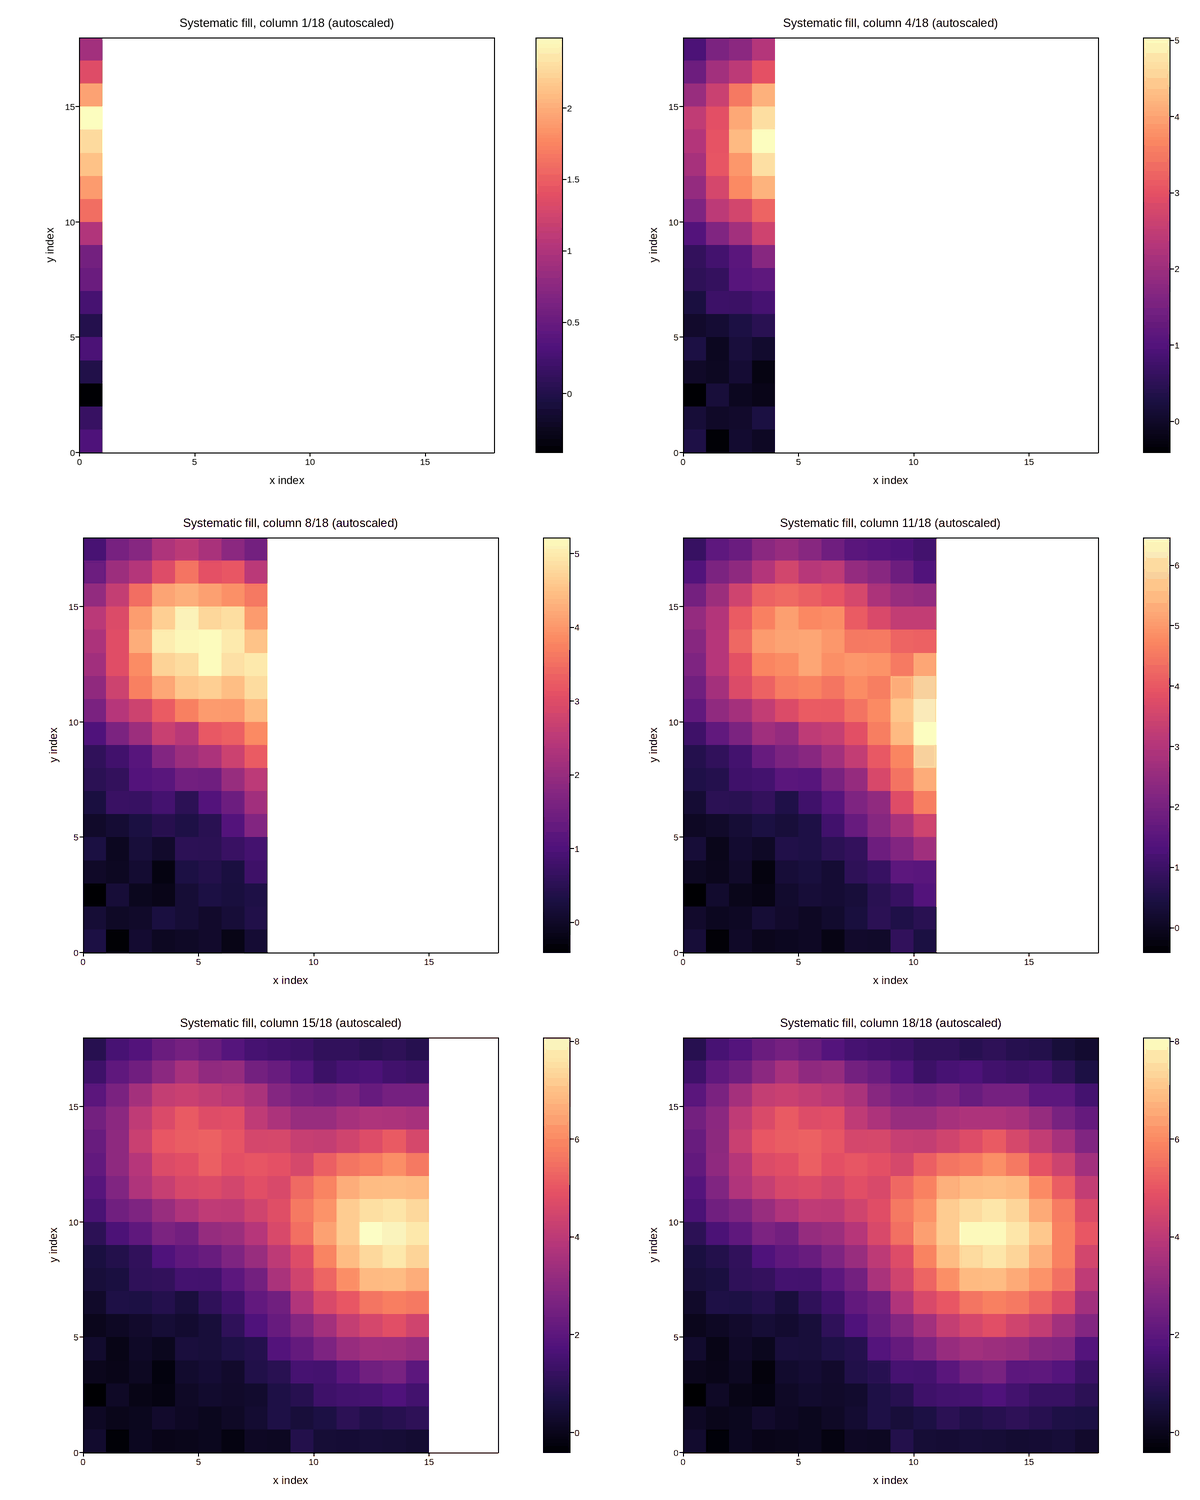
import numpy as np
import plotpress


NY, NX = 18, 18
gx = np.arange(NX + 1, dtype=float)
gy = np.arange(NY + 1, dtype=float)

fig, ax = plotpress.subplots(figsize=(6, 5))
grid = np.full((NY, NX), np.nan)
mesh = LiveArtist(ax, cmap="magma")   # no vmin/vmax -- autoscales every call
_cbar_ax = None


def on_new_column(col_idx, values):
    """Called once per column the scan finishes -- push it into the grid
    and redraw, autoscaling the colour bar to whatever's been measured so
    far.
    """
    global _cbar_ax
    grid[:, col_idx] = values
    mesh.update(gx, gy, grid)
    ax.set_aspect("equal")             # cla() inside update() wiped these
    ax.set_xlabel("x index"); ax.set_ylabel("y index")
    ax.set_title(f"Systematic fill, column {col_idx + 1}/{NX} (autoscaled)")
    if _cbar_ax is not None:
        fig.delaxes(_cbar_ax)
    _cbar_ax = fig.colorbar(mesh.last_artist, ax=ax)
    fig.tight_layout()


# ---------------------------------------------------------------------------
# Data acquisition -- replace this with your own raster scan controller.
# Everything above only needs a column index and its values handed to
# on_new_column() as each column finishes.
# ---------------------------------------------------------------------------
rng = np.random.default_rng(3)
rows, cols = np.meshgrid(np.arange(NY), np.arange(NX), indexing="ij")
field = (np.exp(-((rows - 9) ** 2 + (cols - 13) ** 2) / 30.0) * 8.0
         + np.exp(-((rows - 13) ** 2 + (cols - 4) ** 2) / 20.0) * 5.0
         + 0.15 * rng.standard_normal((NY, NX)))


def read_next_column(col_idx):
    """Stand-in for the scan controller reporting a finished column."""
    return field[:, col_idx]


for col in range(NX):
    on_new_column(col, read_next_column(col))
Total running time of the script: (0 minutes 2.027 seconds)