Note
Go to the end to download the full example code.
Point by point, with axes that grow to fit
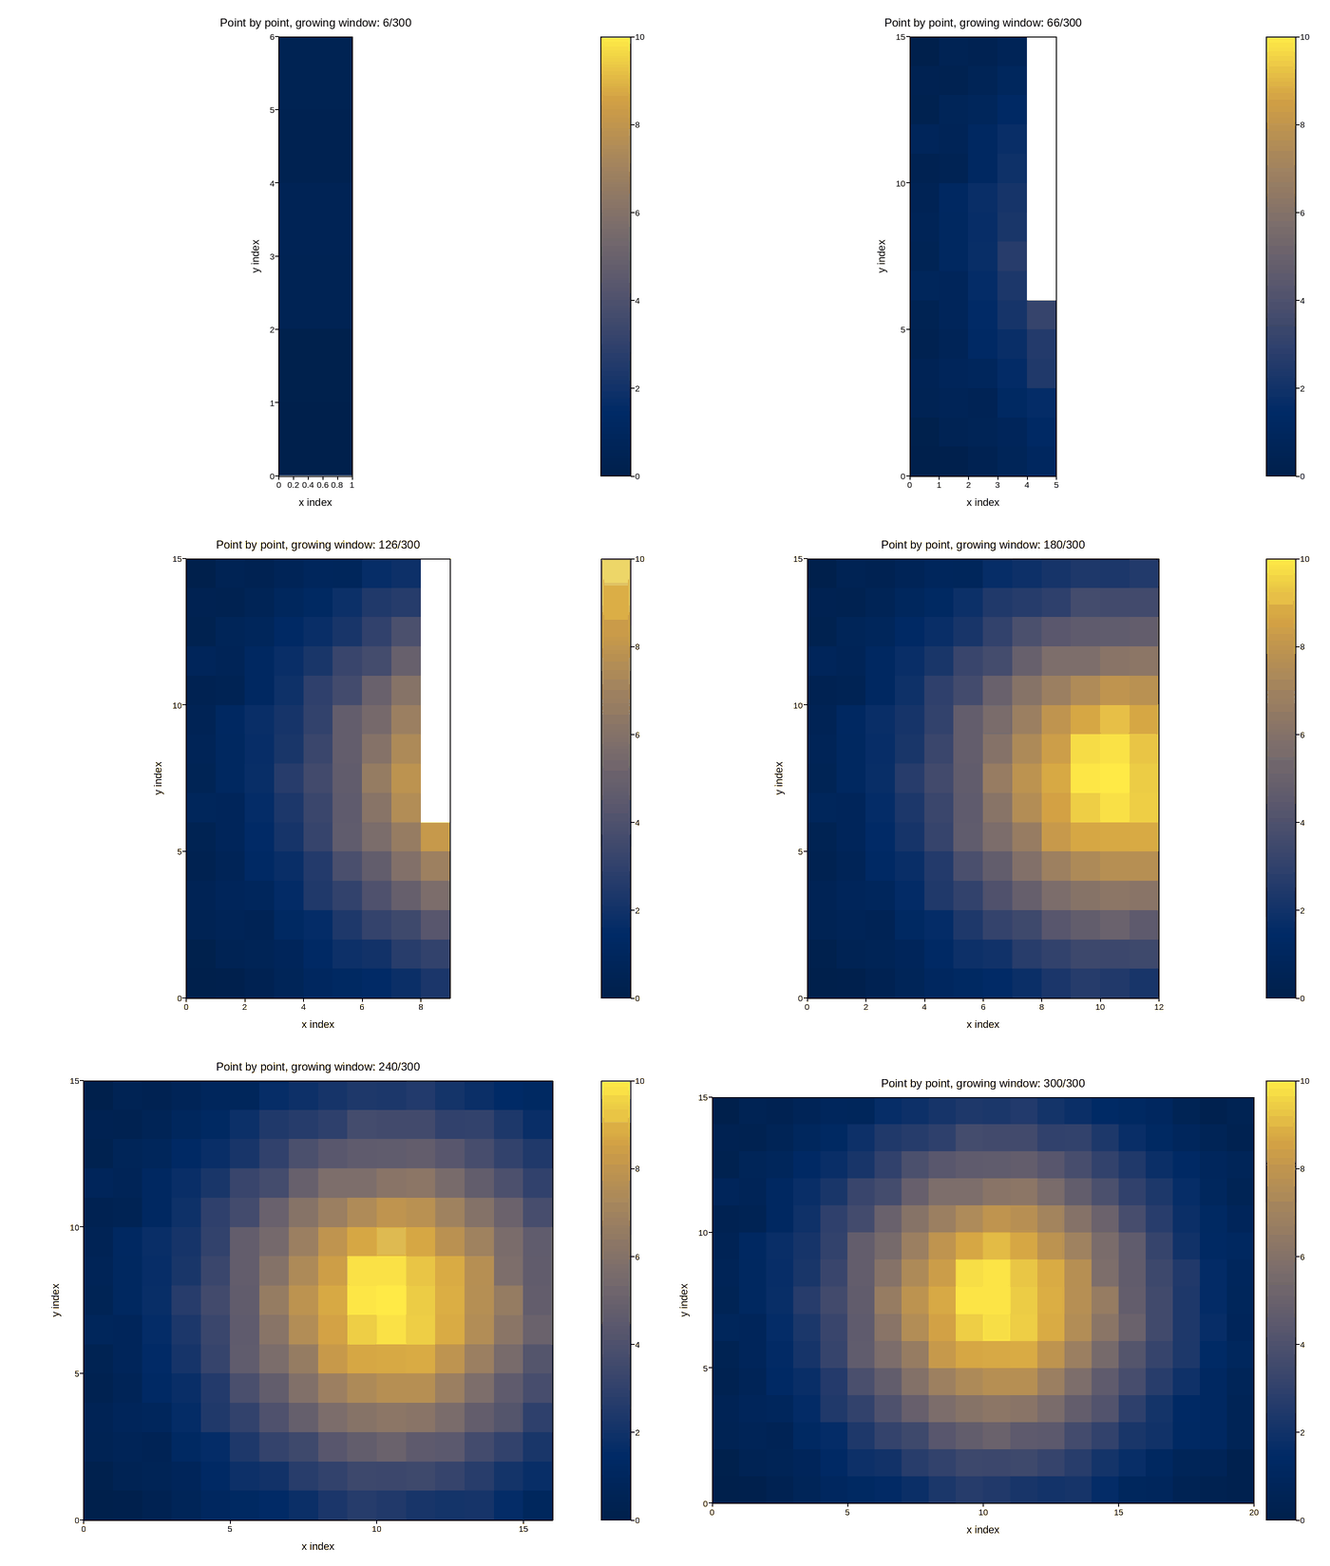
The most general case, combining Point by point, raster order’s true one-measurement-at-a-time raster order with a window that isn’t known up front: the underlying grid exists, but nothing is drawn beyond the bounding box of what’s actually been measured so far, so the visible axes widen a step at a time right along with the data.
The code below is exactly what you’d write against the real
plotpress.qt.LiveArtist: a callback that receives whatever new points
the stage reported since the last tick and pushes the updated grid to the
plot, fed by a loop simulating a raster scan stage. Only
read_next_points() is meant to be replaced, with your own instrument
call.
import numpy as np
import plotpress


NY, NX = 15, 20
gx = np.arange(NX + 1, dtype=float)
gy = np.arange(NY + 1, dtype=float)
VMIN, VMAX = 0.0, 10.0   # the instrument's own known reading range

fig, ax = plotpress.subplots(figsize=(7, 5.5))
grid = np.full((NY, NX), np.nan)
mesh = LiveArtist(ax, cmap="cividis", vmin=VMIN, vmax=VMAX)
bbox = {"r_min": None, "r_max": None, "c_min": None, "c_max": None}

# One-time colorbar: the scale is fixed, so it never needs a per-frame
# refresh the way plot_02_systematic_fill's autoscaled one does.
m0 = ax.pcolormesh(gx, gy, grid, cmap="cividis", vmin=VMIN, vmax=VMAX)
fig.colorbar(m0, ax=ax)


def on_new_points(points):
    """Called once per acquisition tick with whatever ``(row, col, value)``
    points the stage reported since the last one -- push them into the
    grid and widen the visible window to the bounding box of everything
    measured so far.
    """
    for r, c, v in points:
        grid[r, c] = v
        bbox["r_min"] = r if bbox["r_min"] is None else min(bbox["r_min"], r)
        bbox["r_max"] = r if bbox["r_max"] is None else max(bbox["r_max"], r)
        bbox["c_min"] = c if bbox["c_min"] is None else min(bbox["c_min"], c)
        bbox["c_max"] = c if bbox["c_max"] is None else max(bbox["c_max"], c)

    mesh.update(gx, gy, grid)
    ax.set_xlim(bbox["c_min"], bbox["c_max"] + 1)   # cla() wiped this
    ax.set_ylim(bbox["r_min"], bbox["r_max"] + 1)   # -- bbox of what's revealed
    ax.set_aspect("equal")
    ax.set_xlabel("x index"); ax.set_ylabel("y index")
    n_seen = int(np.count_nonzero(~np.isnan(grid)))
    ax.set_title(f"Point by point, growing window: {n_seen}/{NY * NX}")
    fig.tight_layout()


# ---------------------------------------------------------------------------
# Data acquisition -- replace this with your own raster stage controller.
# Everything above only needs a list of (row, col, value) points handed to
# on_new_points() as they're measured.
# ---------------------------------------------------------------------------
rng = np.random.default_rng(5)
cols, rows = np.meshgrid(np.arange(NX), np.arange(NY))
field = np.clip(
    np.exp(-((rows - 7) ** 2 + (cols - 10) ** 2) / 35.0) * 10.0
    + 0.15 * rng.standard_normal((NY, NX)), 0.0, None)

# Same raster order as plot_05_point_by_point: column by column, bottom to
# top within each column.
order = [(r, c) for c in range(NX) for r in range(NY)]
POINTS_PER_TICK = 6


def read_next_points(lo, hi):
    """Stand-in for the stage reporting whichever points it measured this
    tick, in raster order.
    """
    return [(r, c, float(field[r, c])) for r, c in order[lo:hi]]


for lo in range(0, len(order), POINTS_PER_TICK):
    hi = min(lo + POINTS_PER_TICK, len(order))
    on_new_points(read_next_points(lo, hi))
Total running time of the script: (0 minutes 4.708 seconds)