Lab instrument examples
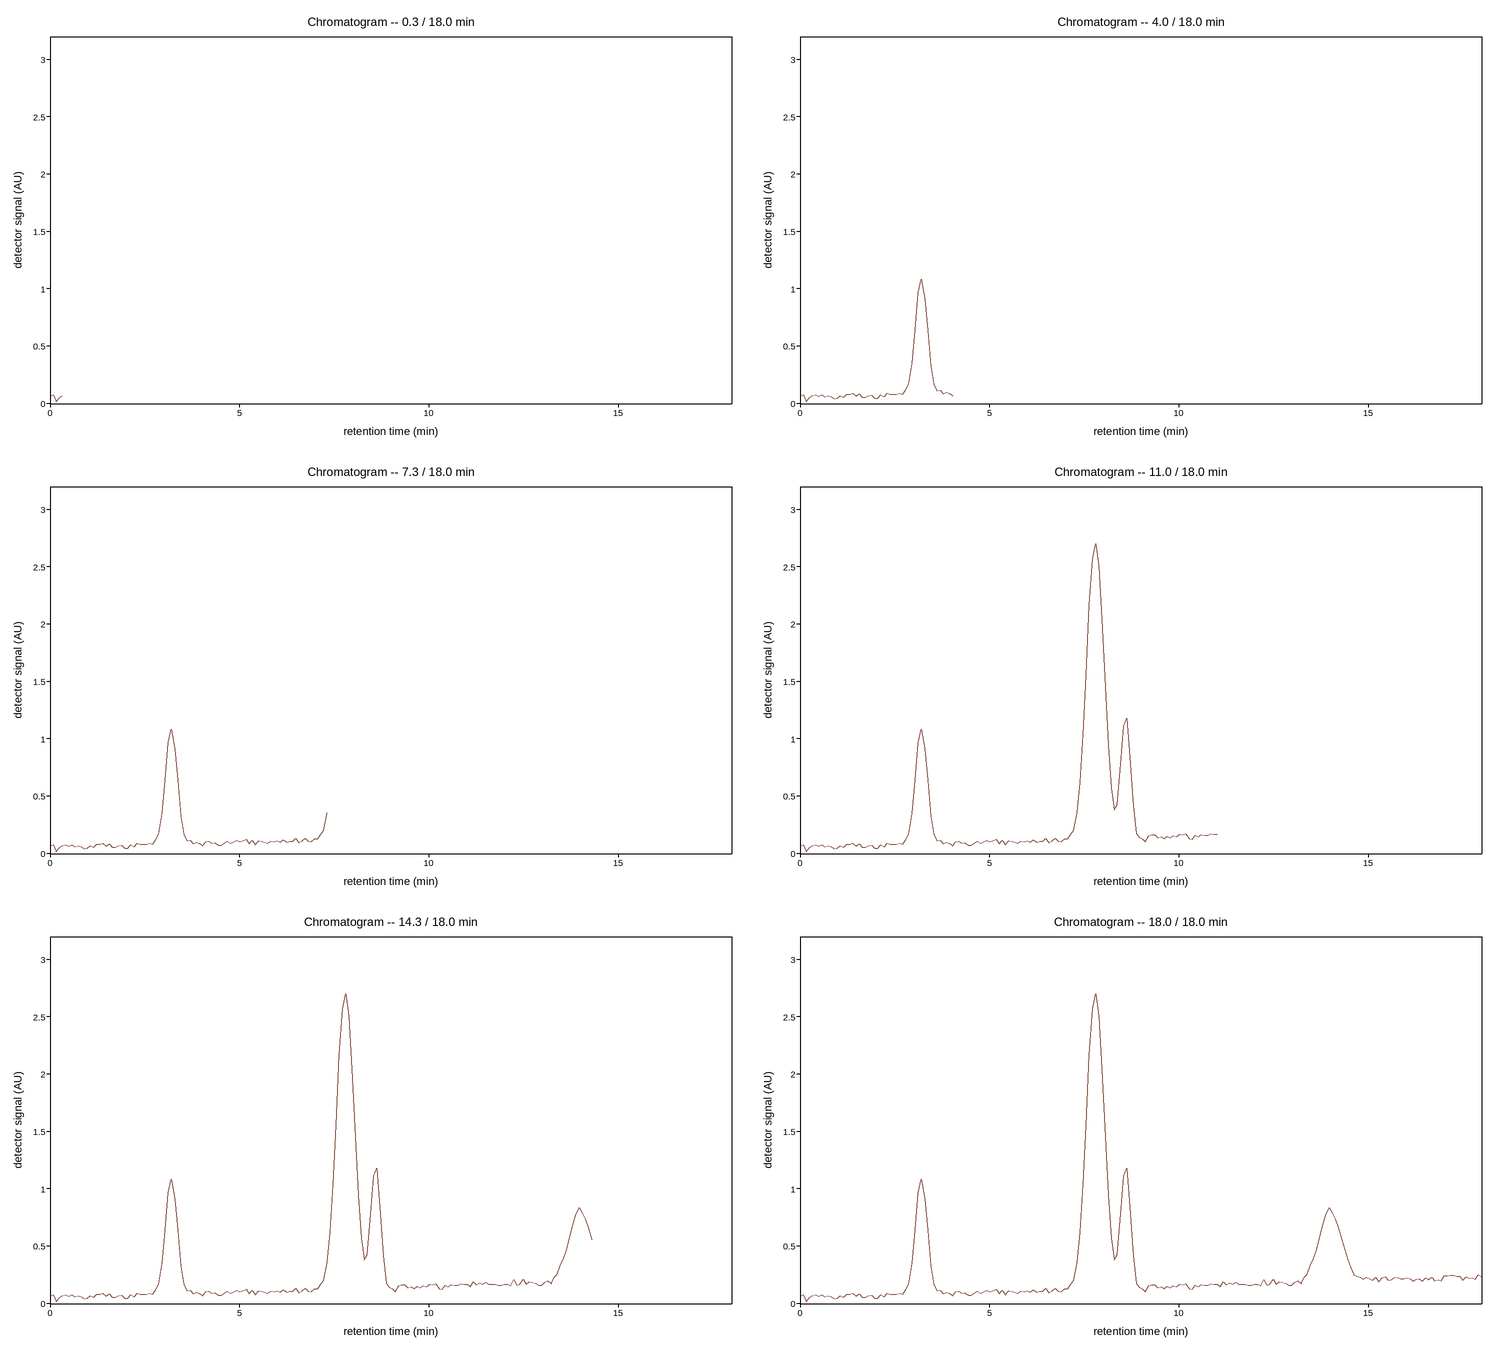
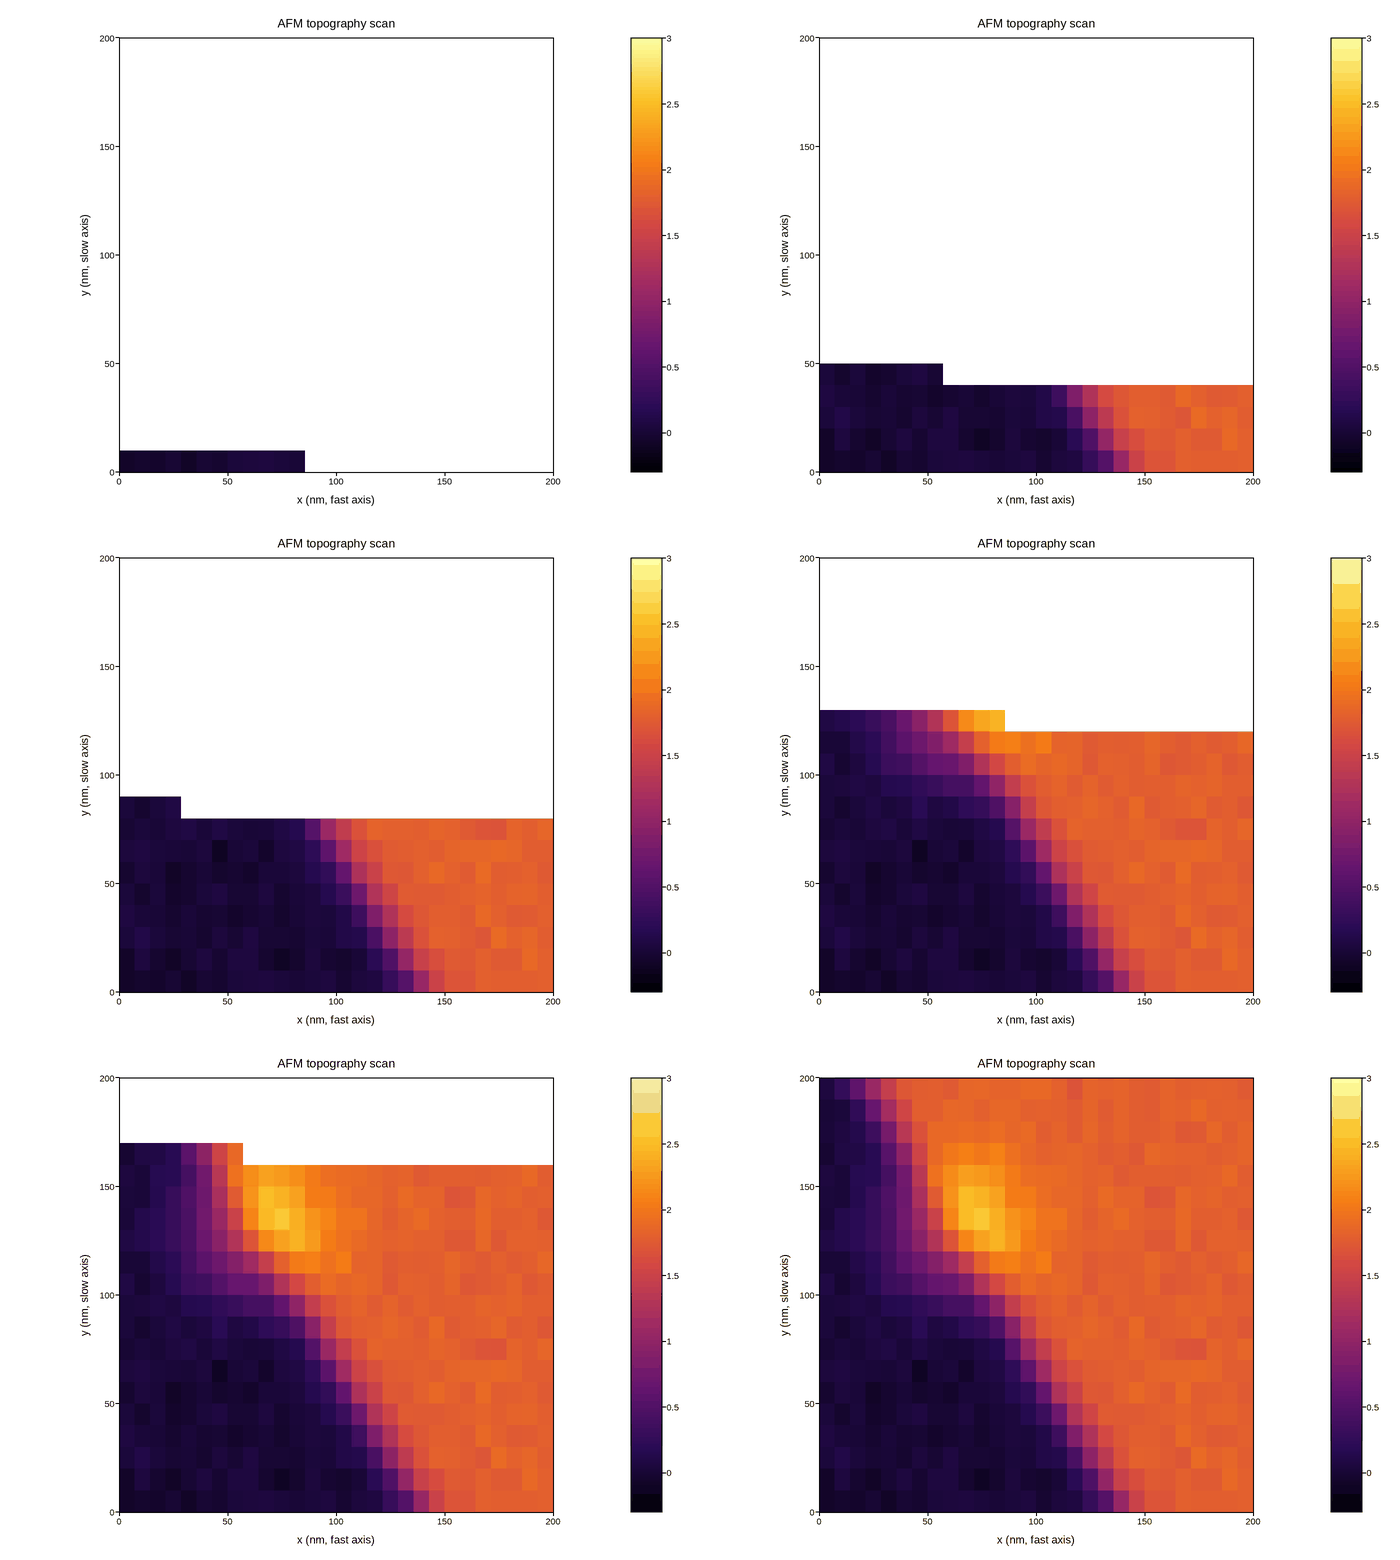
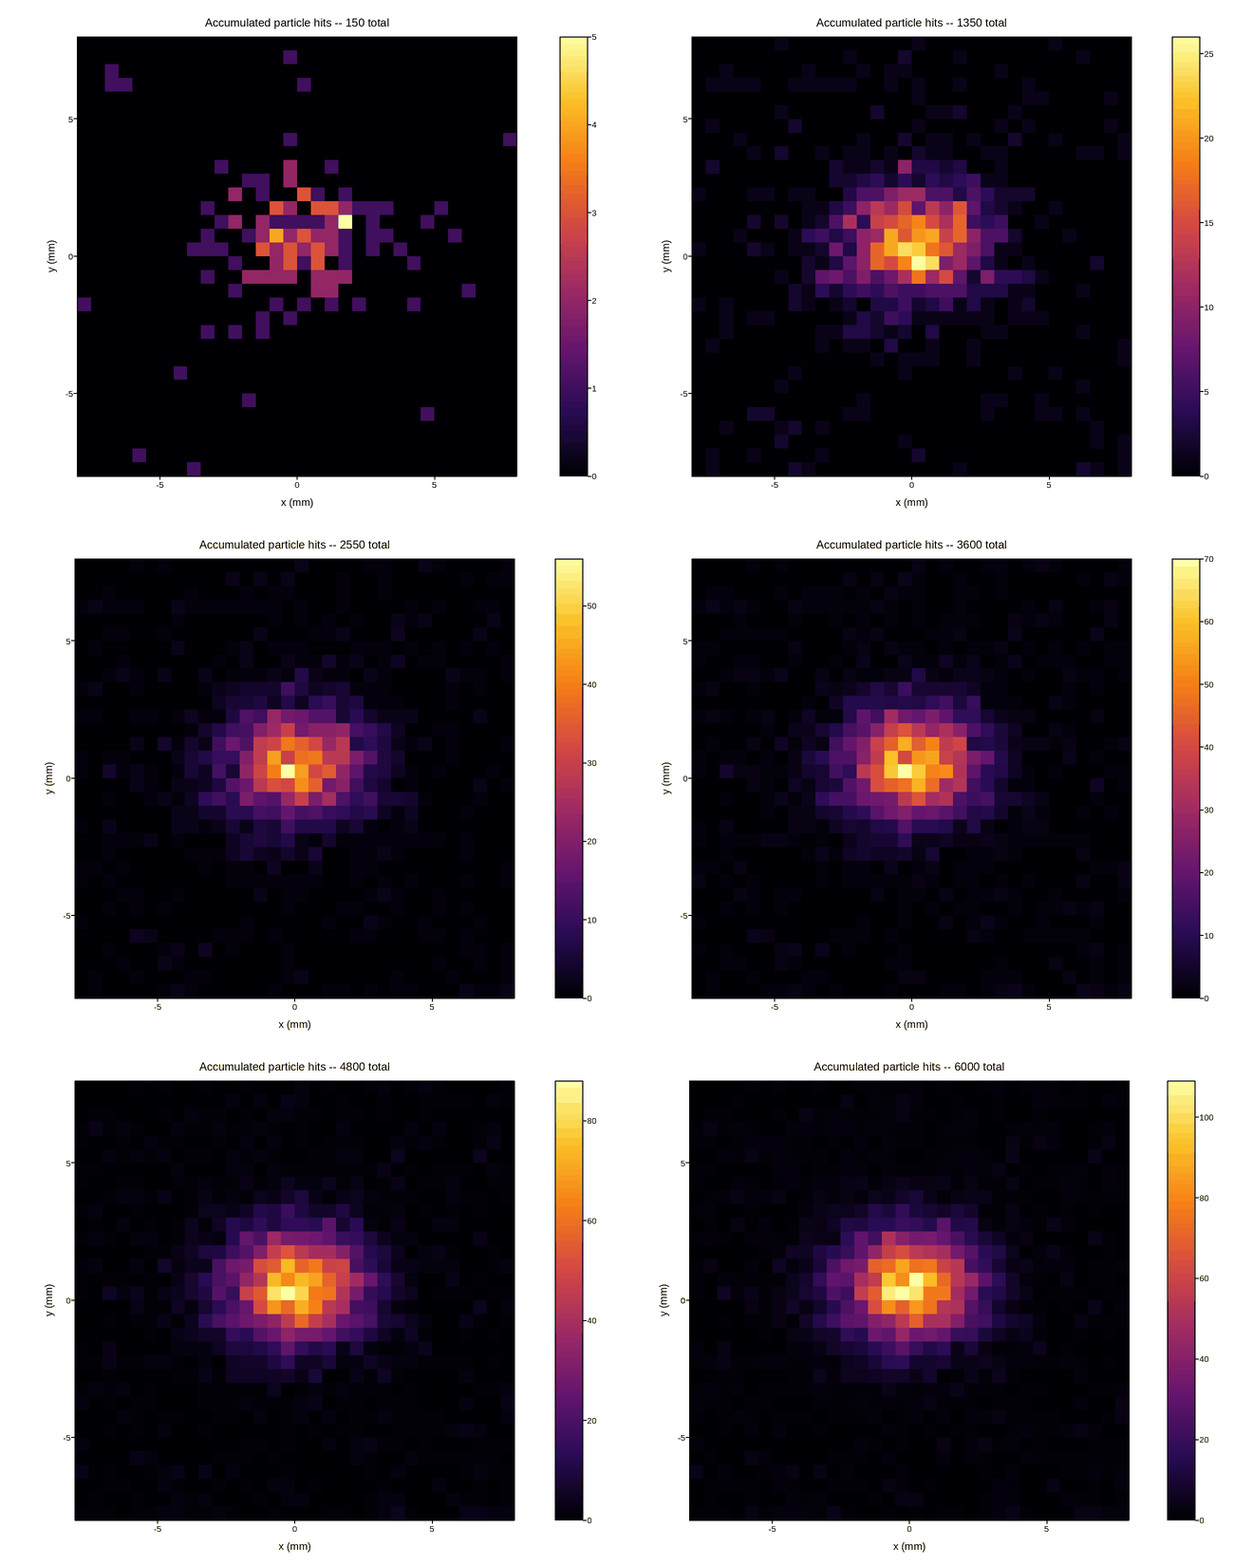
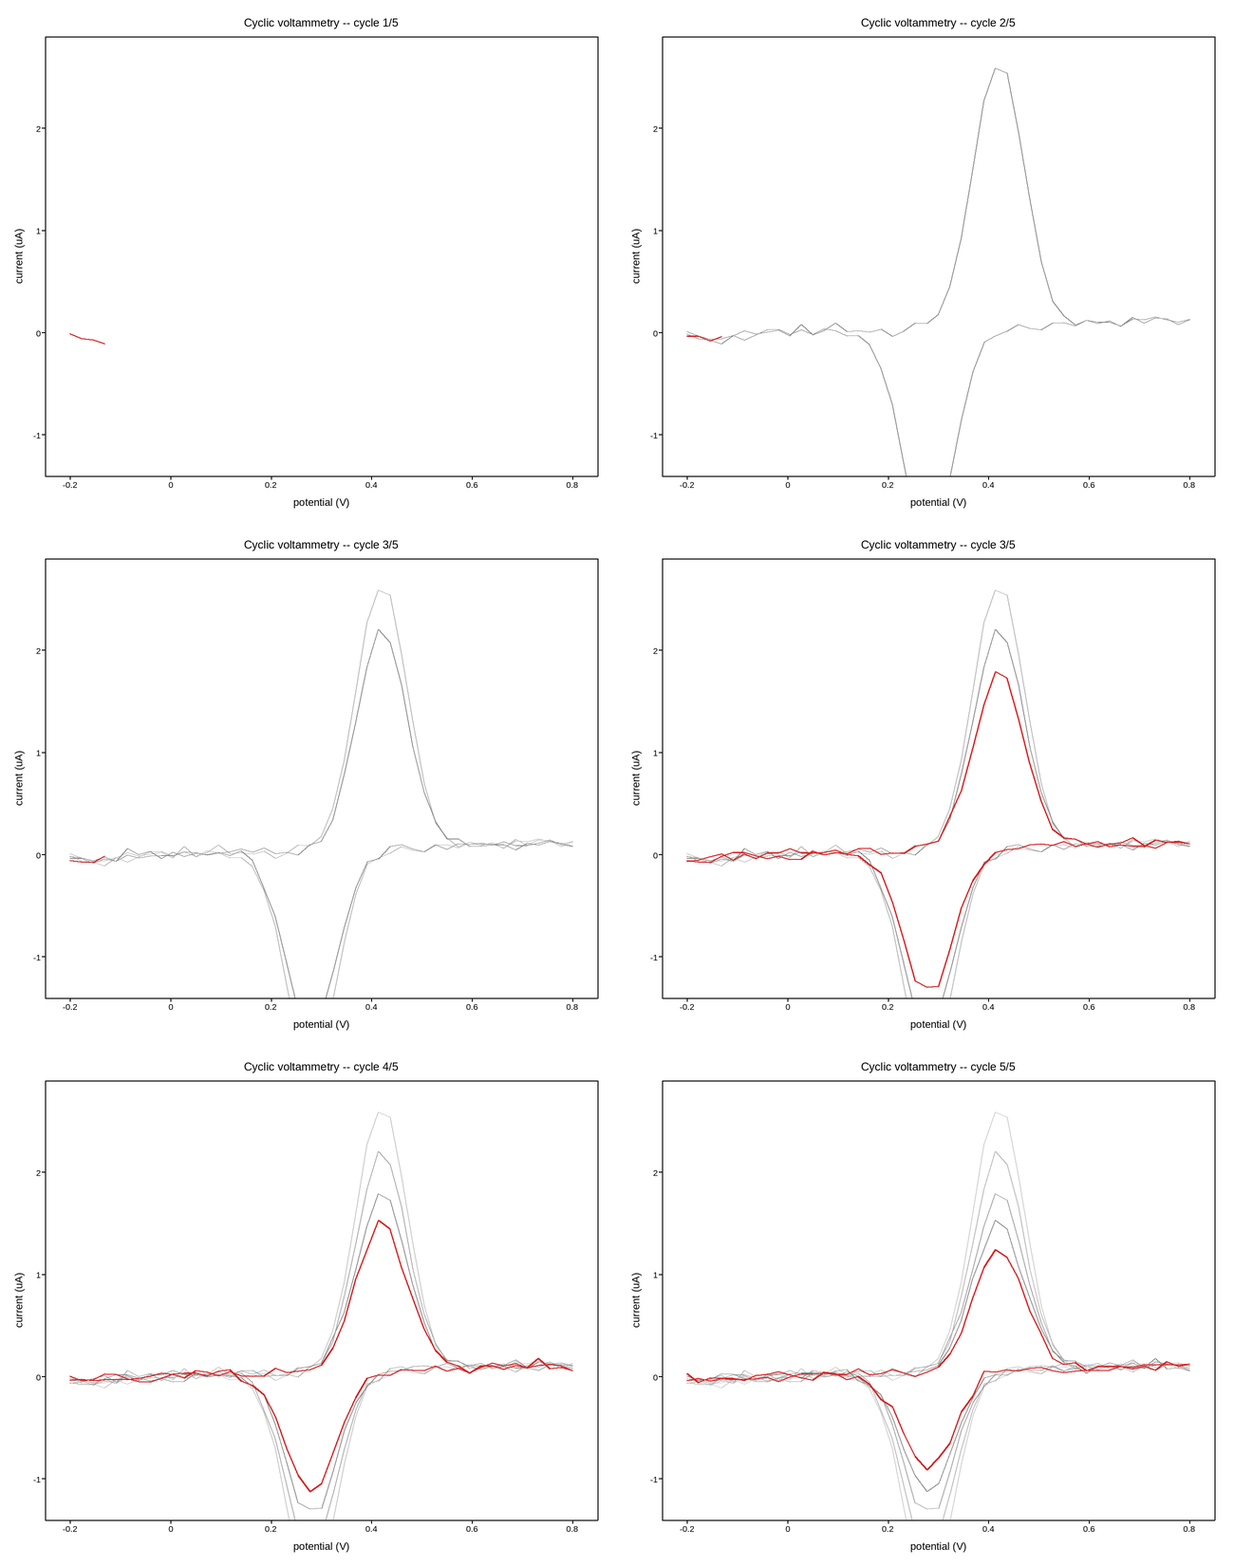
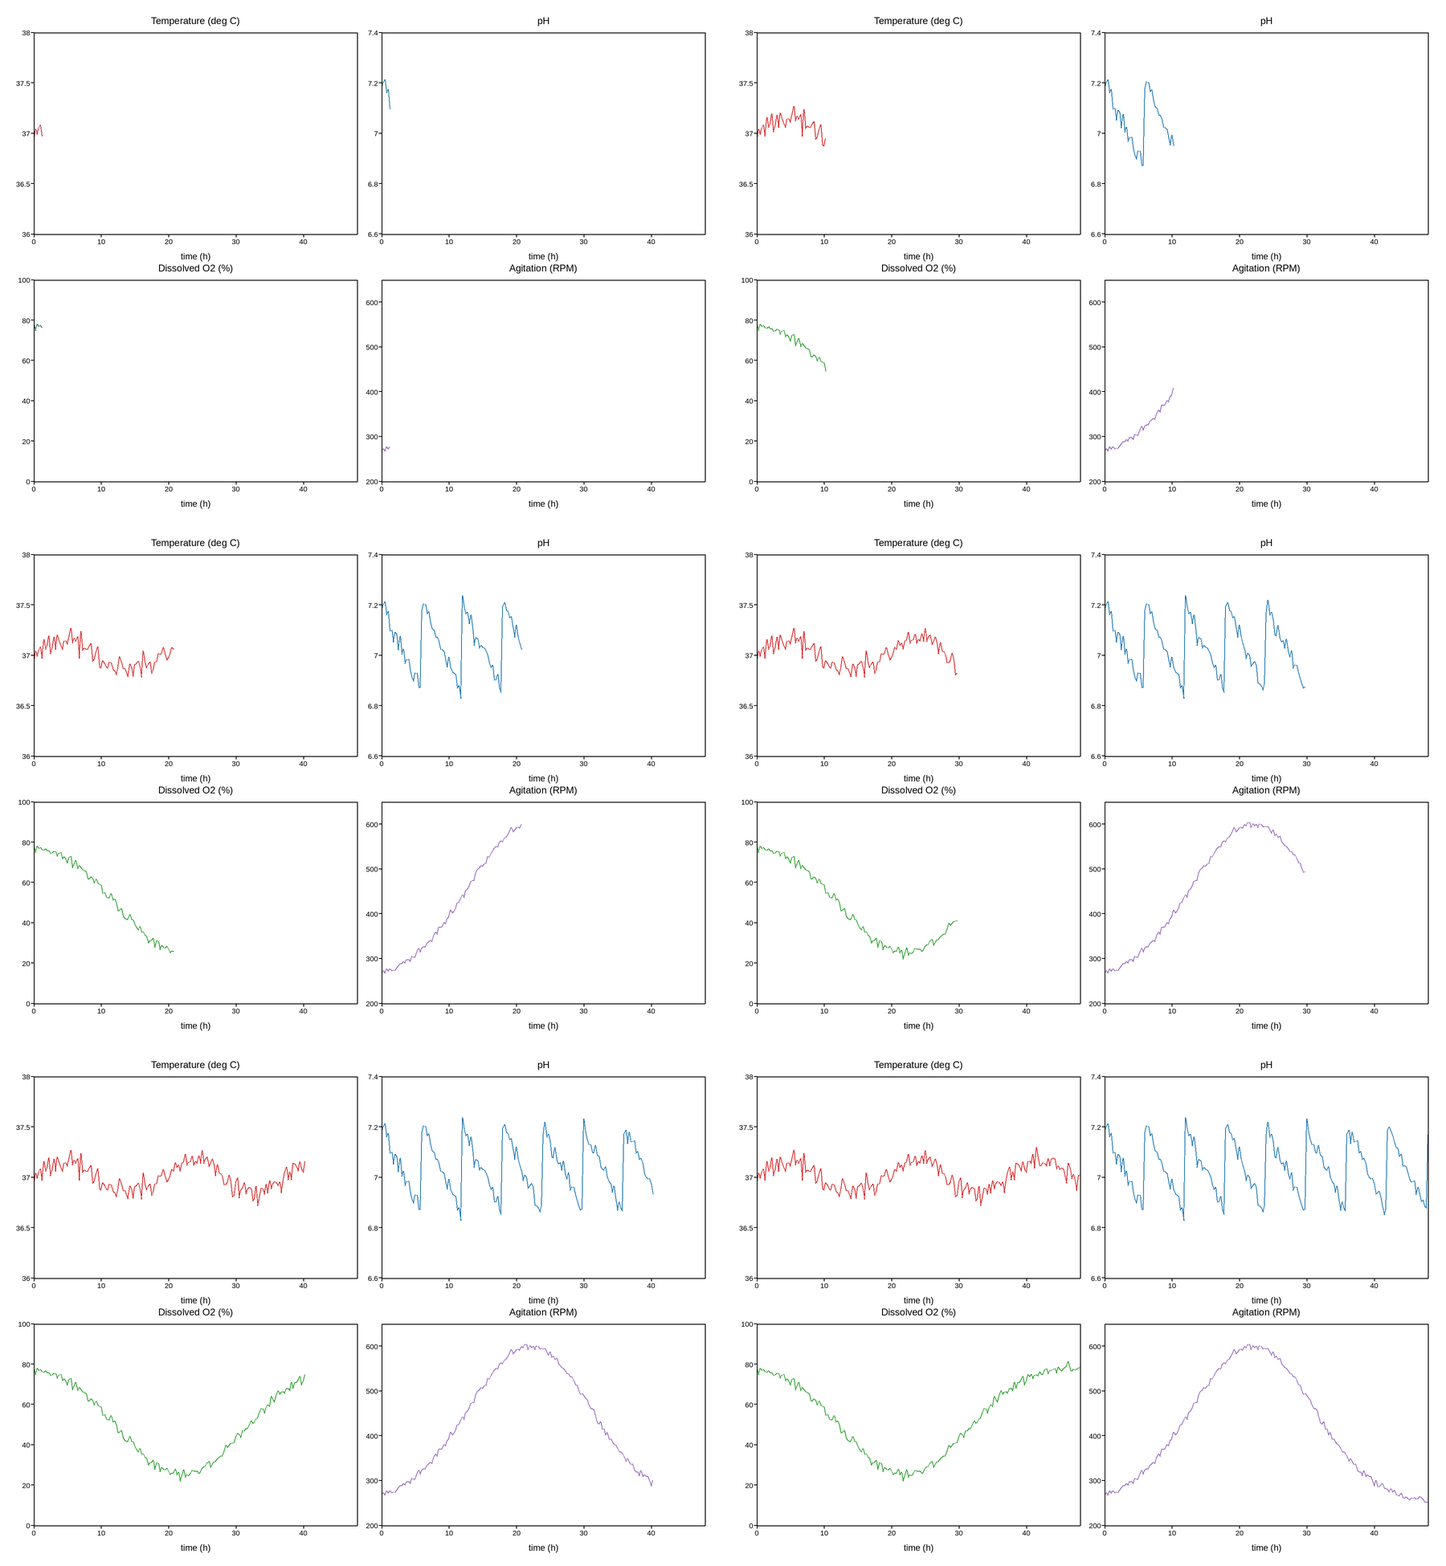
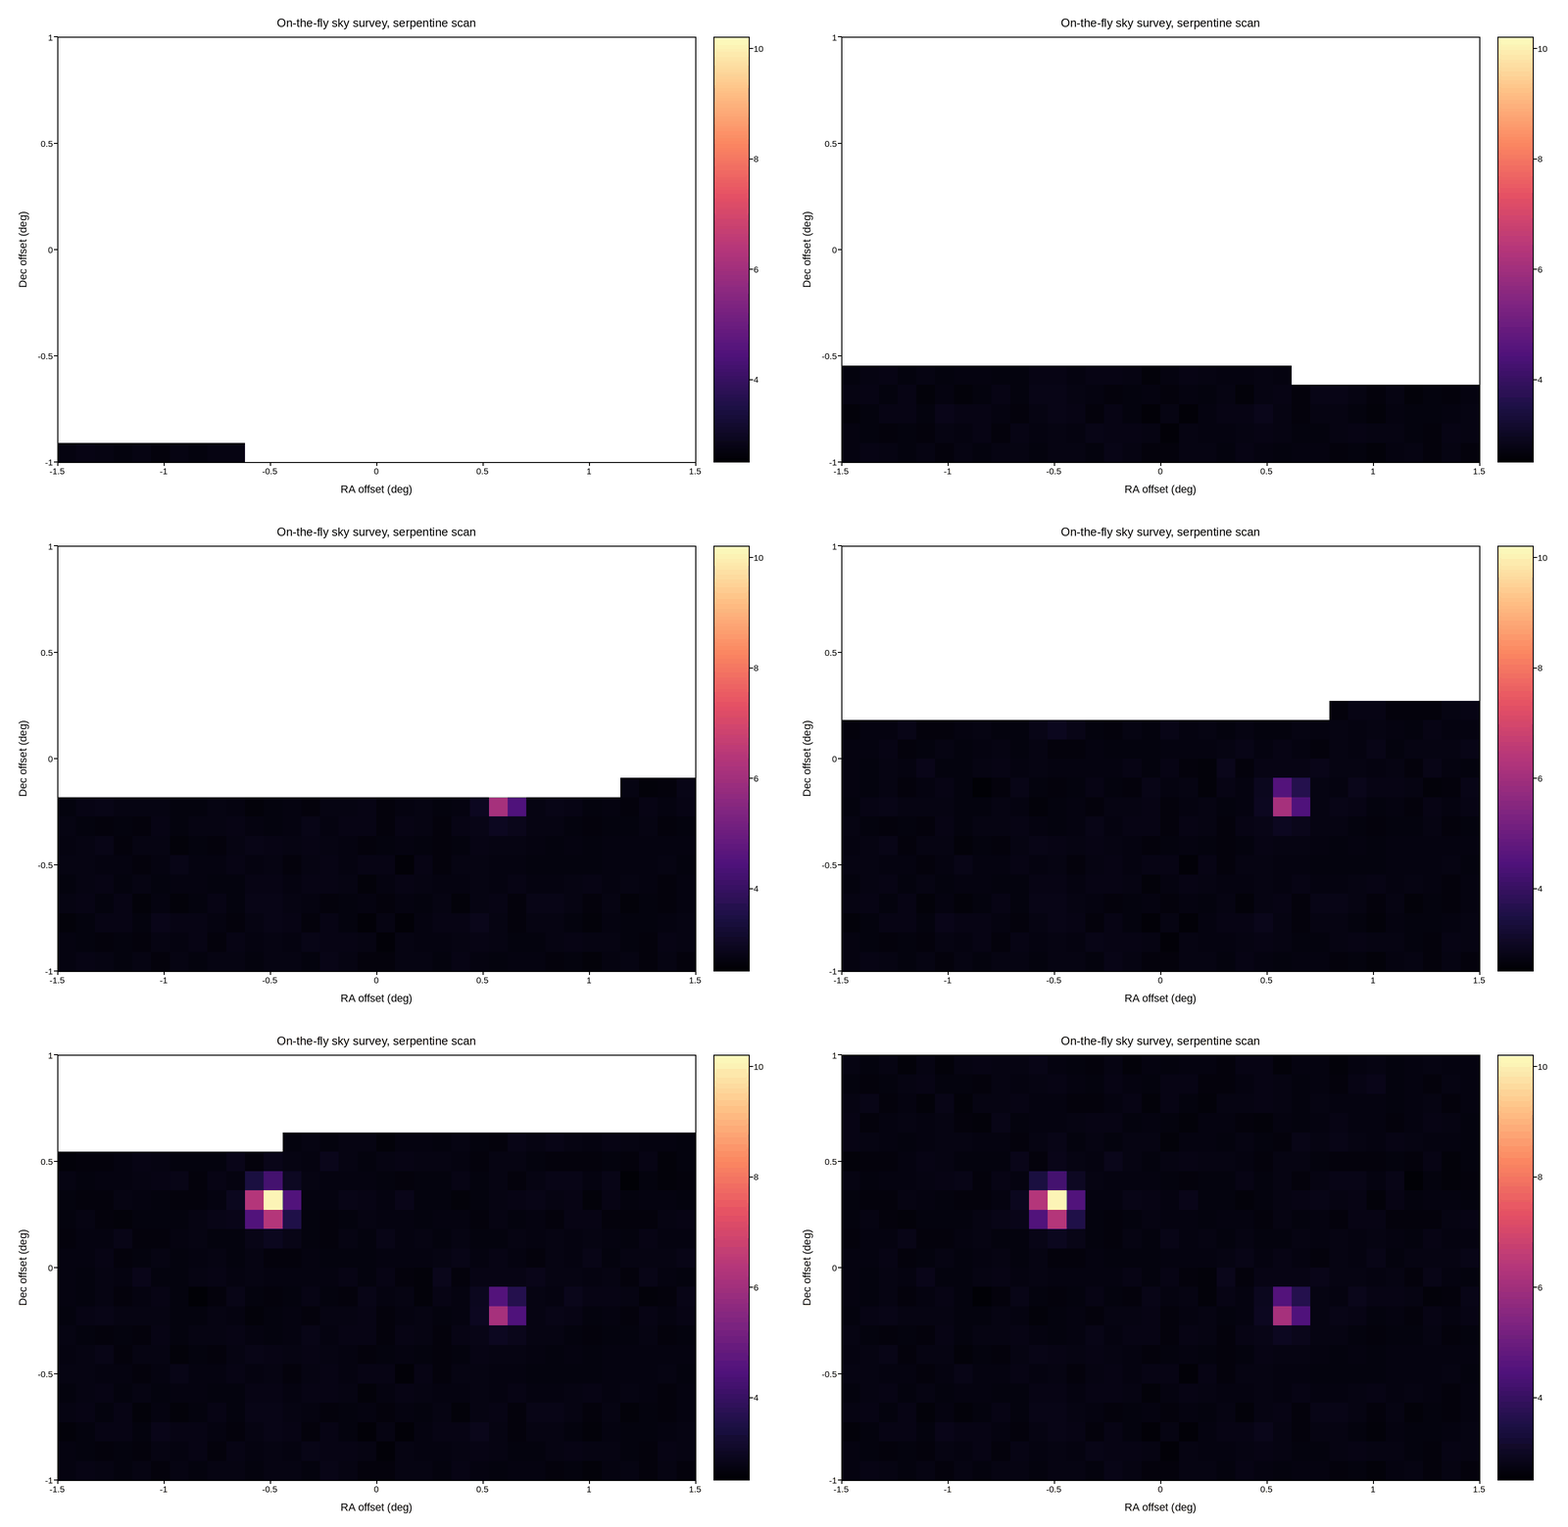
The acquisition shapes in Acquisition patterns, applied to
specific instruments a working lab actually watches update in real time –
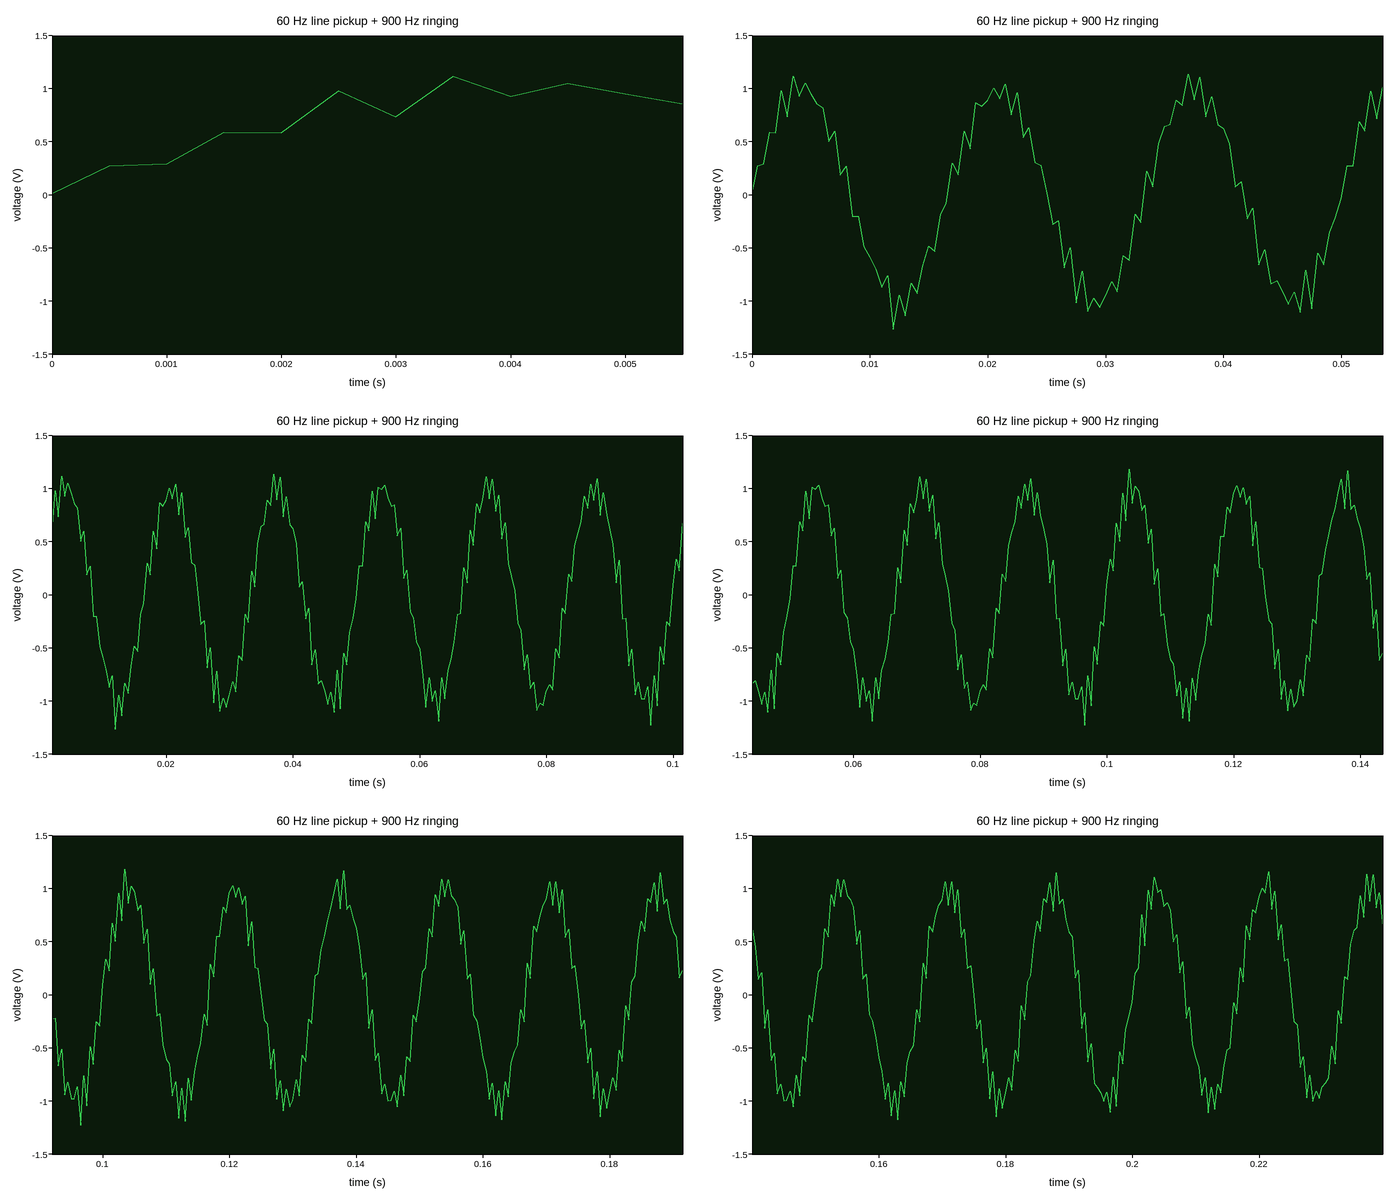
an oscilloscope’s rolling buffer, a titration’s growing curve, a raster
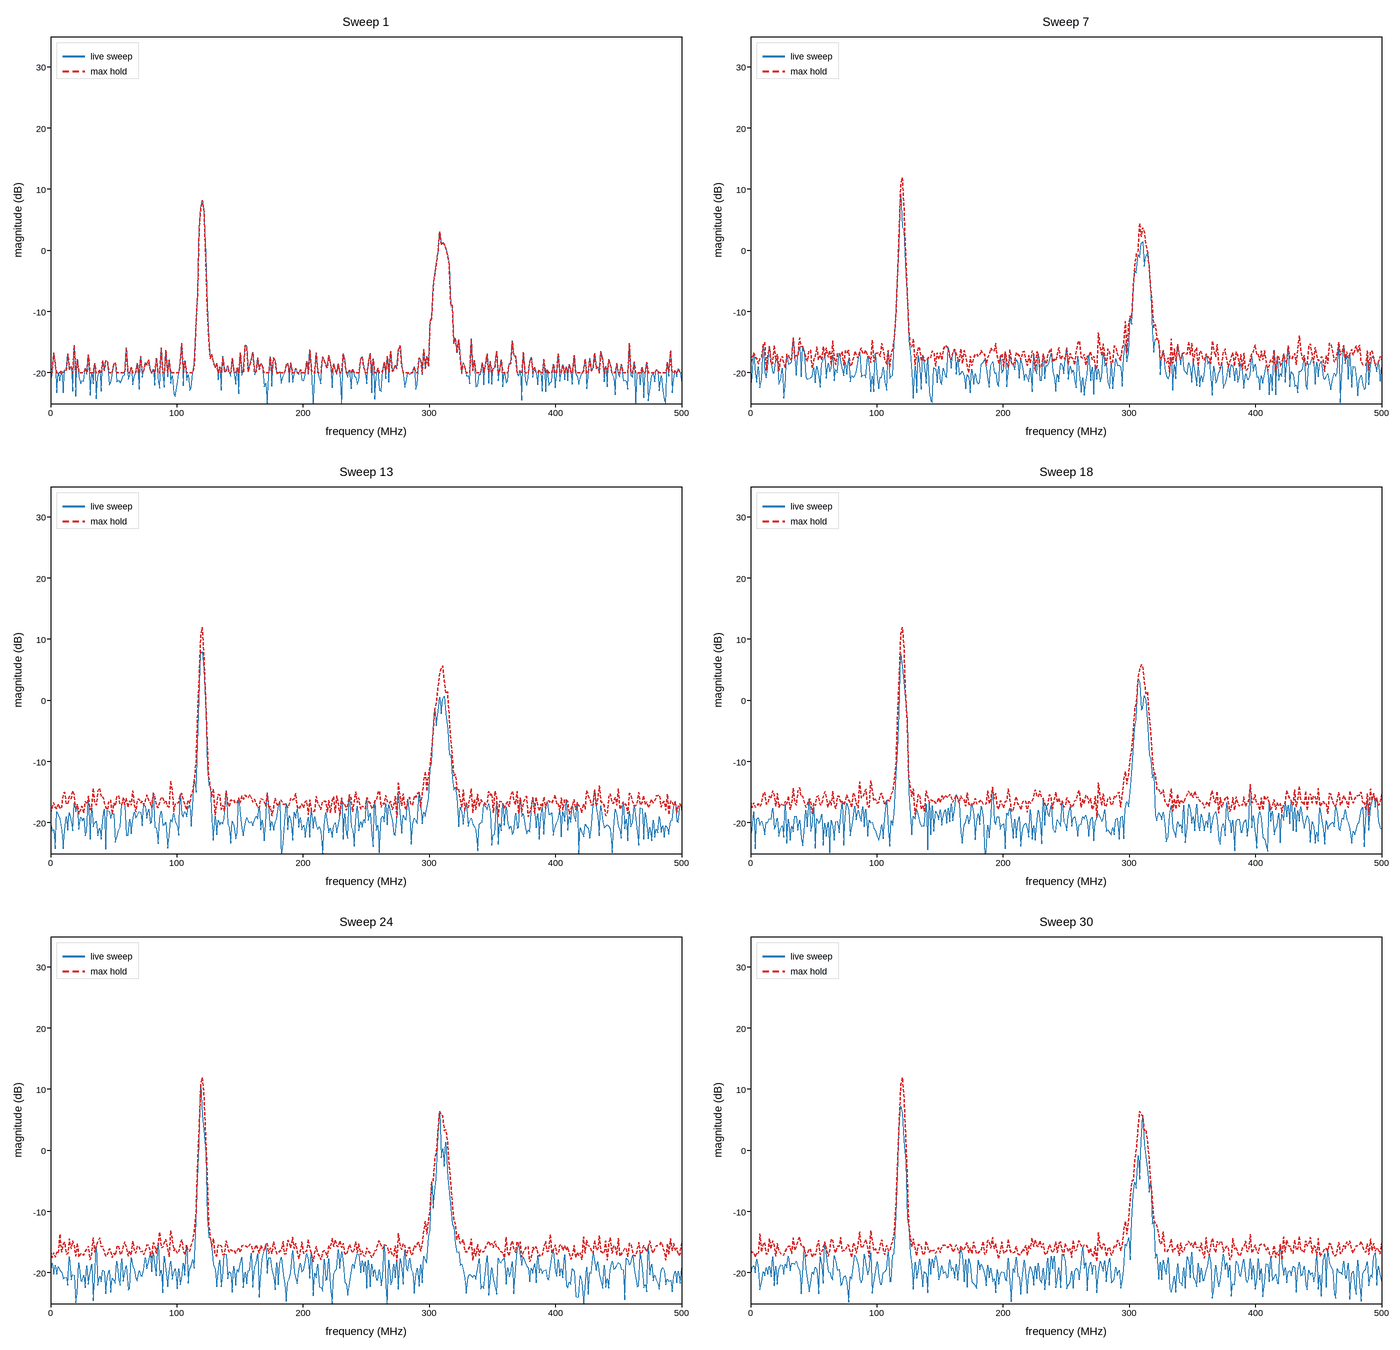
scanning microscope’s point-by-point image, a detector’s accumulating hit
map, two searches driven by the adaptive
package’s own sampling strategy, and more. Each is the same kind of update a
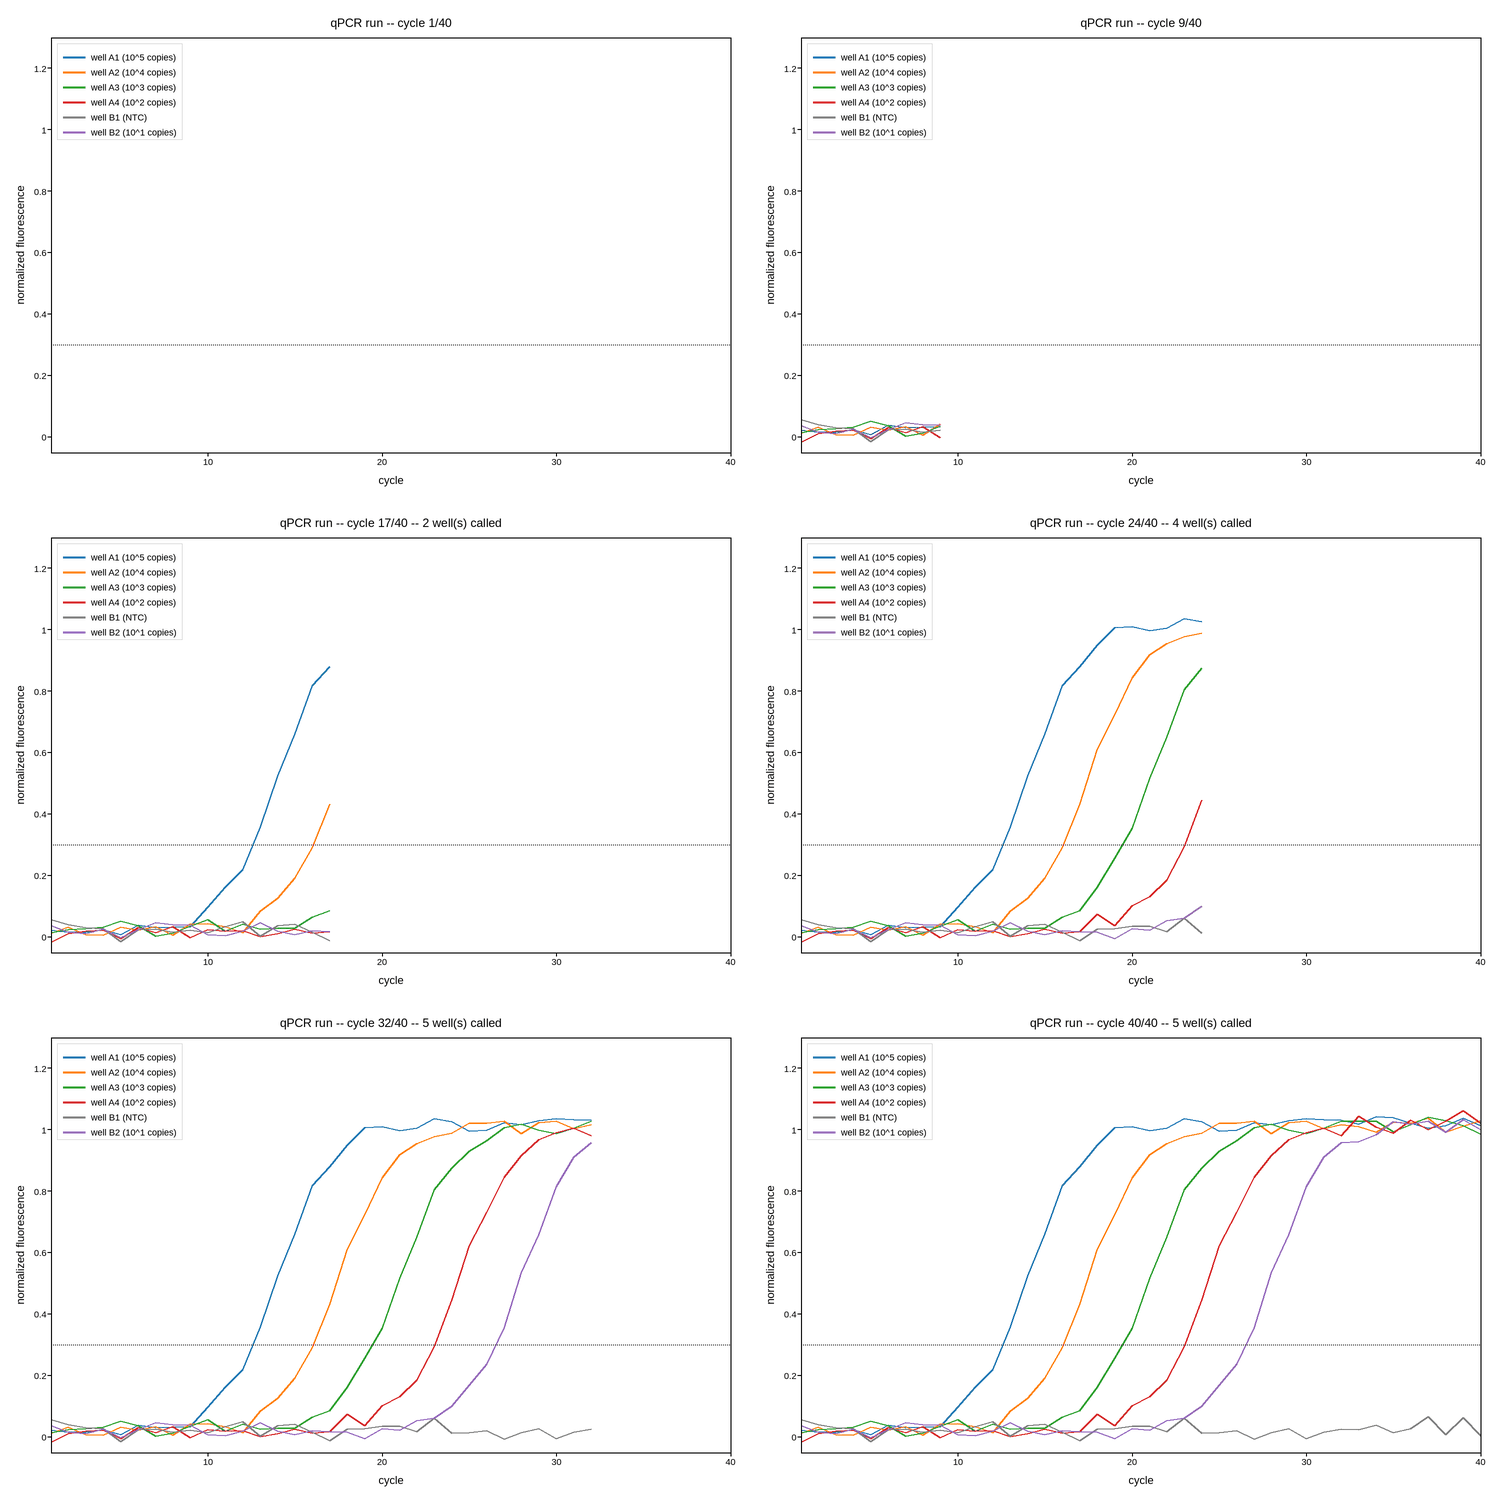
real plotpress.qt.LiveArtist would drive live; these render the sequence
as a GIF since the doc build has no Qt binding to drive a real window with.
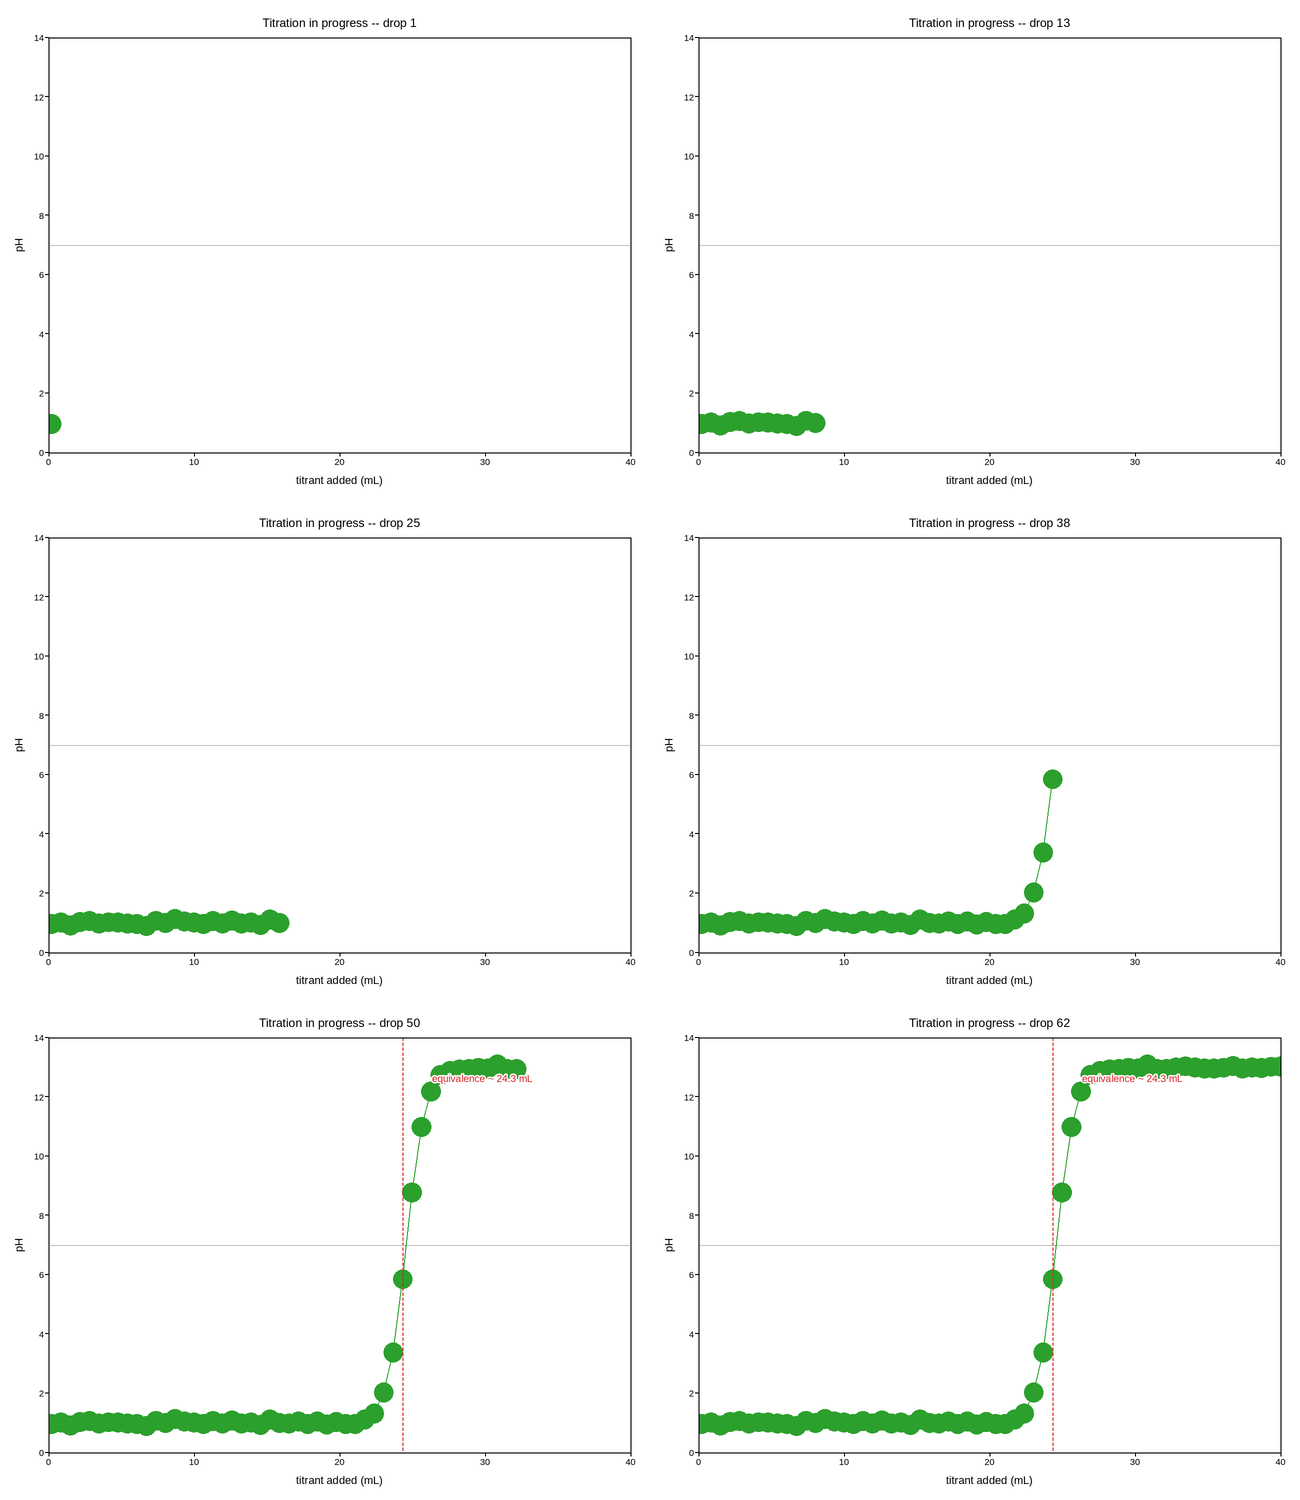
Titration curve, marking the equivalence point live
Titration curve, marking the equivalence point live
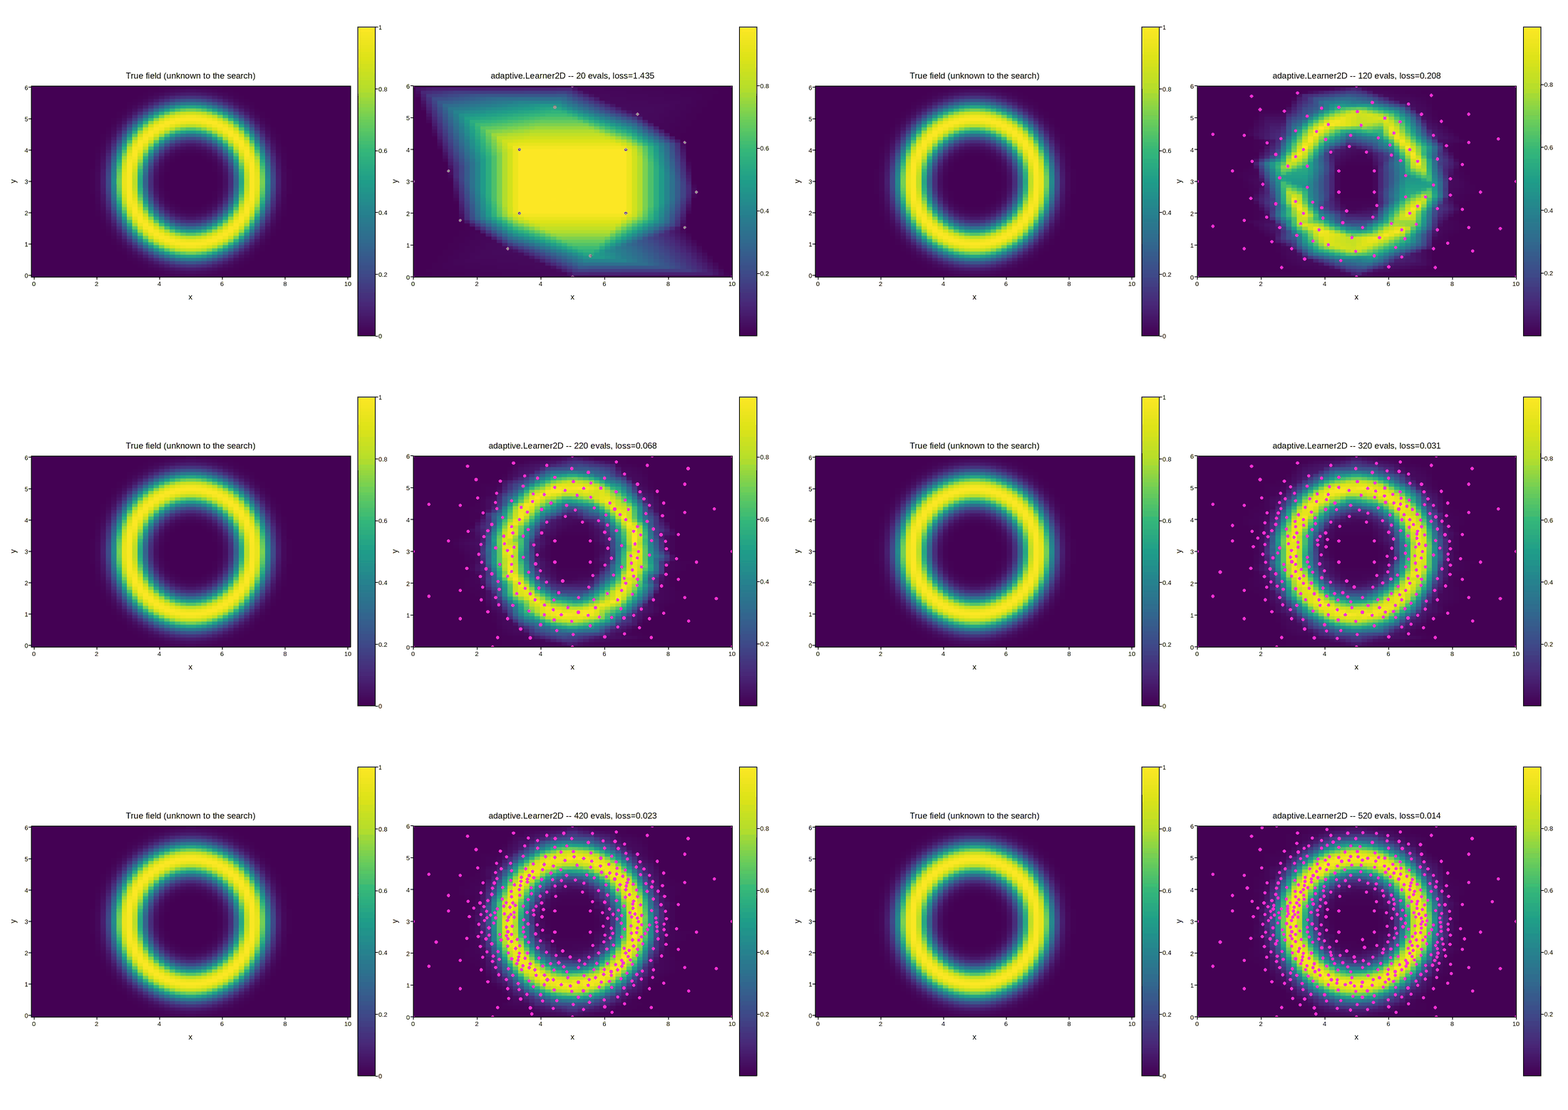
Adaptive search for a halo, with the adaptive package
Adaptive search for a halo, with the adaptive package
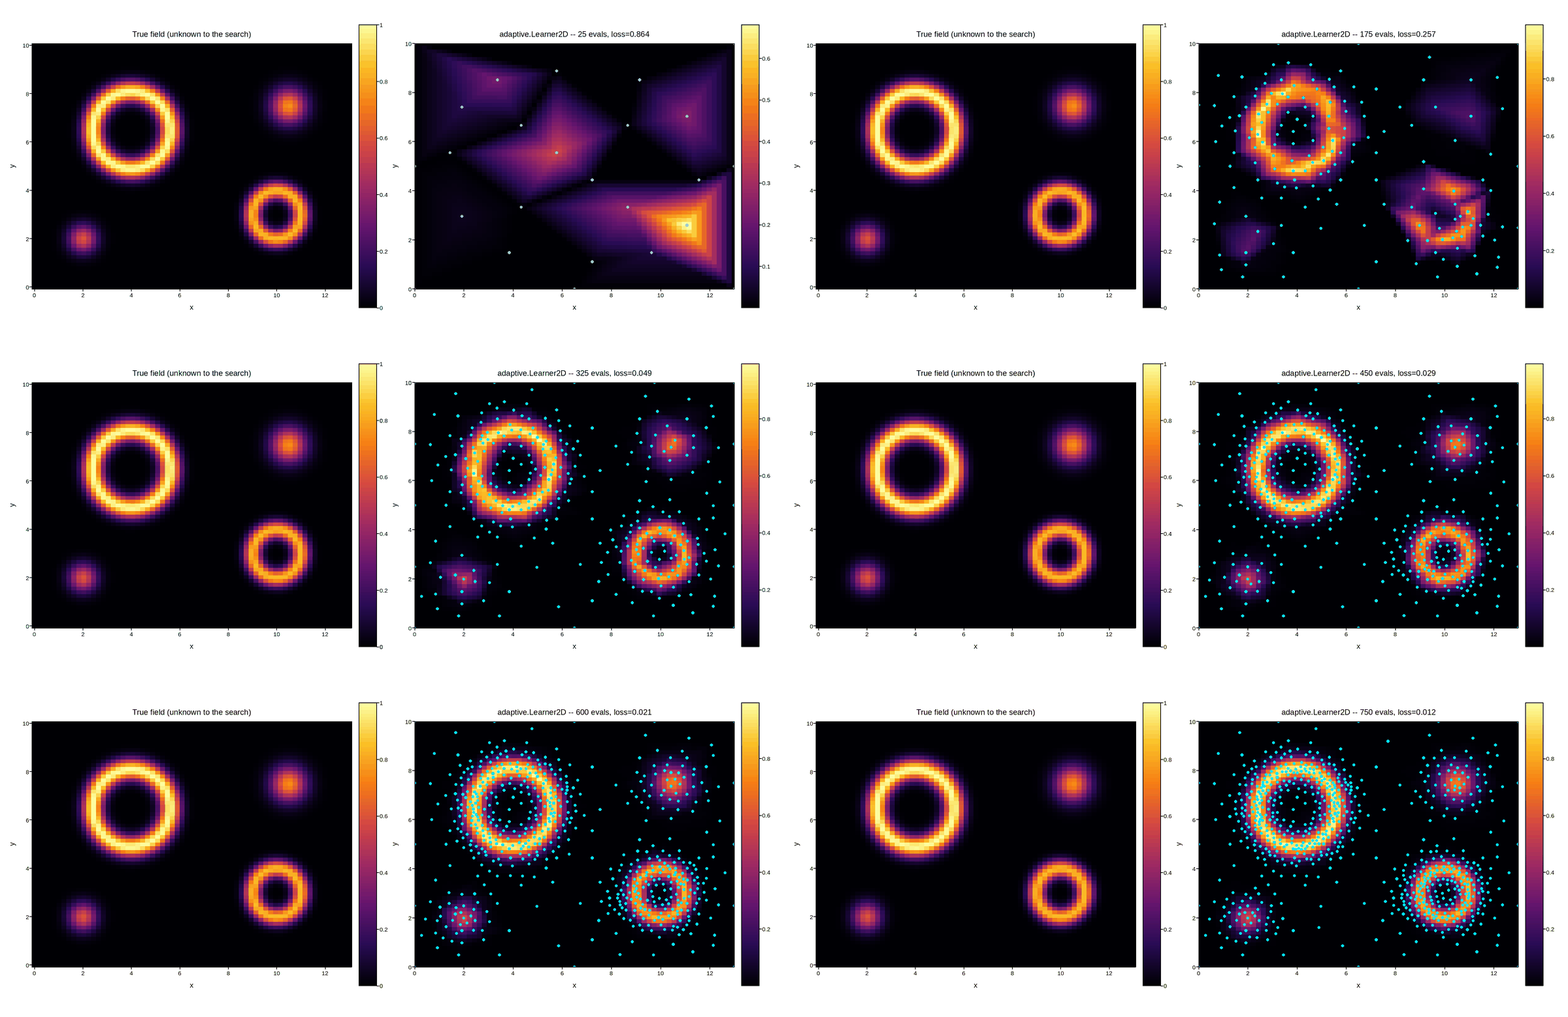
Adaptive search across several separated anomalies
Adaptive search across several separated anomalies