Note
Go to the end to download the full example code.
Particle-hit accumulation map
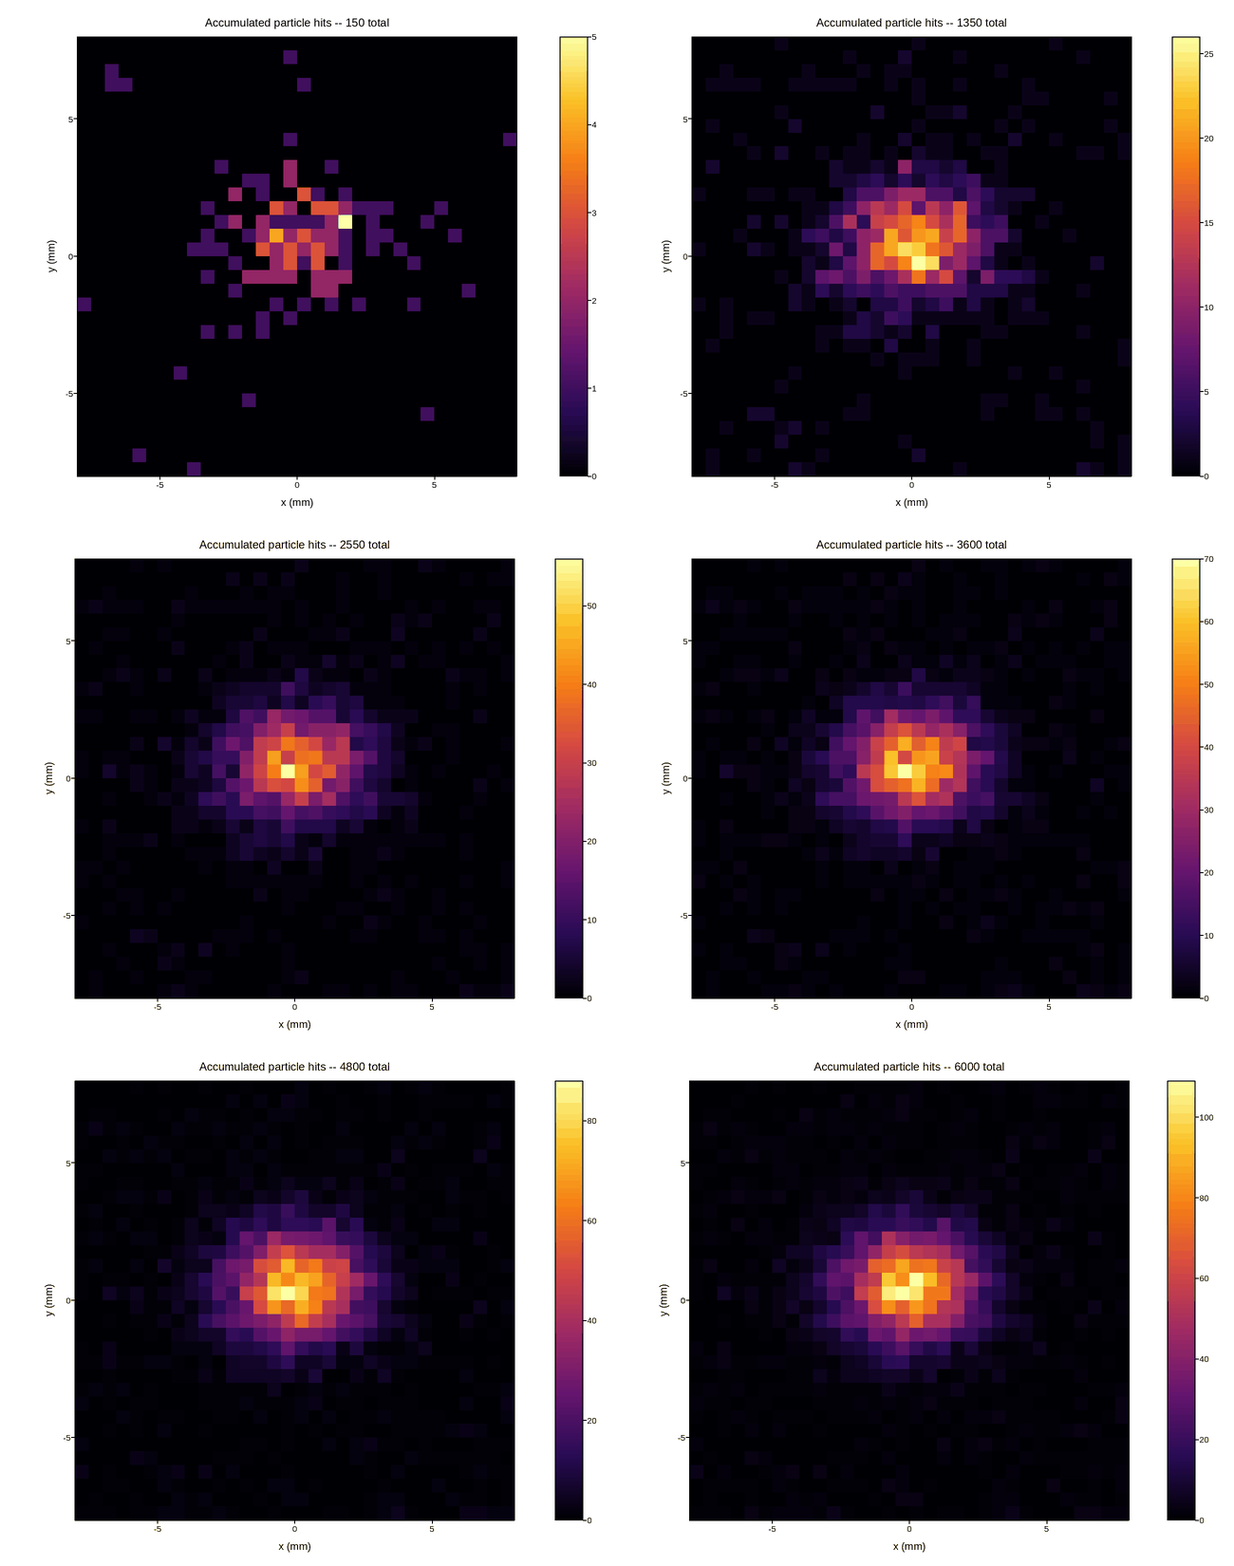
A photon-counting detector or a beam-profile monitor doesn’t fill in a grid of already-known values – every bin starts at zero and increments each time a new hit lands in it, the same bin often getting hit many times over the course of a run. That’s a different update rule from every other mesh example in this gallery (which reveal or replace a value once). Counts only ever go up, but there’s no telling in advance how high they’ll climb, so the colour scale autoscales to the running total the same way Systematic acquisition with an autoscaling colour bar does.
The code below is exactly what you’d write against the real
plotpress.qt.LiveArtist: a callback that receives whatever new hits the
detector reported since the last tick and pushes the updated histogram to
the plot, fed by a loop simulating the detector’s own readout. Only
read_next_hits() is meant to be replaced, with your own instrument
call.
import numpy as np
import plotpress


NY, NX = 32, 32
gx = np.linspace(-8, 8, NX + 1)
gy = np.linspace(-8, 8, NY + 1)

fig, ax = plotpress.subplots(figsize=(6.5, 5.5))
counts = np.zeros((NY, NX))
mesh = LiveArtist(ax, cmap="inferno")   # no vmin/vmax -- autoscales every call
_cbar_ax = None


def on_new_hits(hx, hy):
    """Called once per acquisition tick with the (x, y) positions of
    whatever new hits landed since the last one -- bin them into the
    running histogram and redraw, autoscaling to the highest count so far.
    """
    global _cbar_ax
    hist, _, _ = np.histogram2d(hy, hx, bins=[gy, gx])
    counts[:] += hist

    mesh.update(gx, gy, counts)
    ax.set_aspect("equal")             # cla() inside update() wiped these
    ax.set_xlabel("x (mm)"); ax.set_ylabel("y (mm)")
    ax.set_title(f"Accumulated particle hits -- {int(counts.sum())} total")
    if _cbar_ax is not None:
        fig.delaxes(_cbar_ax)
    _cbar_ax = fig.colorbar(mesh.last_artist, ax=ax)
    fig.tight_layout()


# ---------------------------------------------------------------------------
# Data acquisition -- replace this with your own detector readout. Every-
# thing above only needs the (x, y) positions of new hits handed to
# on_new_hits() as they arrive.
# ---------------------------------------------------------------------------
rng = np.random.default_rng(12)
# A beam profile (2-D Gaussian) plus flat background -- the same shape a
# real detector's hit distribution takes.
N_HITS_TOTAL = 6000
HITS_PER_TICK = 150
BEAM_FRAC = 0.85


def read_next_hits():
    """Stand-in for the detector reporting whichever hits landed this
    tick.
    """
    n_beam = int(HITS_PER_TICK * BEAM_FRAC)
    n_bg = HITS_PER_TICK - n_beam
    hx = np.concatenate([rng.normal(0.0, 1.6, n_beam), rng.uniform(-8, 8, n_bg)])
    hy = np.concatenate([rng.normal(0.5, 1.3, n_beam), rng.uniform(-8, 8, n_bg)])
    return hx, hy


for _ in range(N_HITS_TOTAL // HITS_PER_TICK):
    on_new_hits(*read_next_hits())
Total running time of the script: (0 minutes 5.505 seconds)