Note
Go to the end to download the full example code.
Chromatography trace with live peak detection
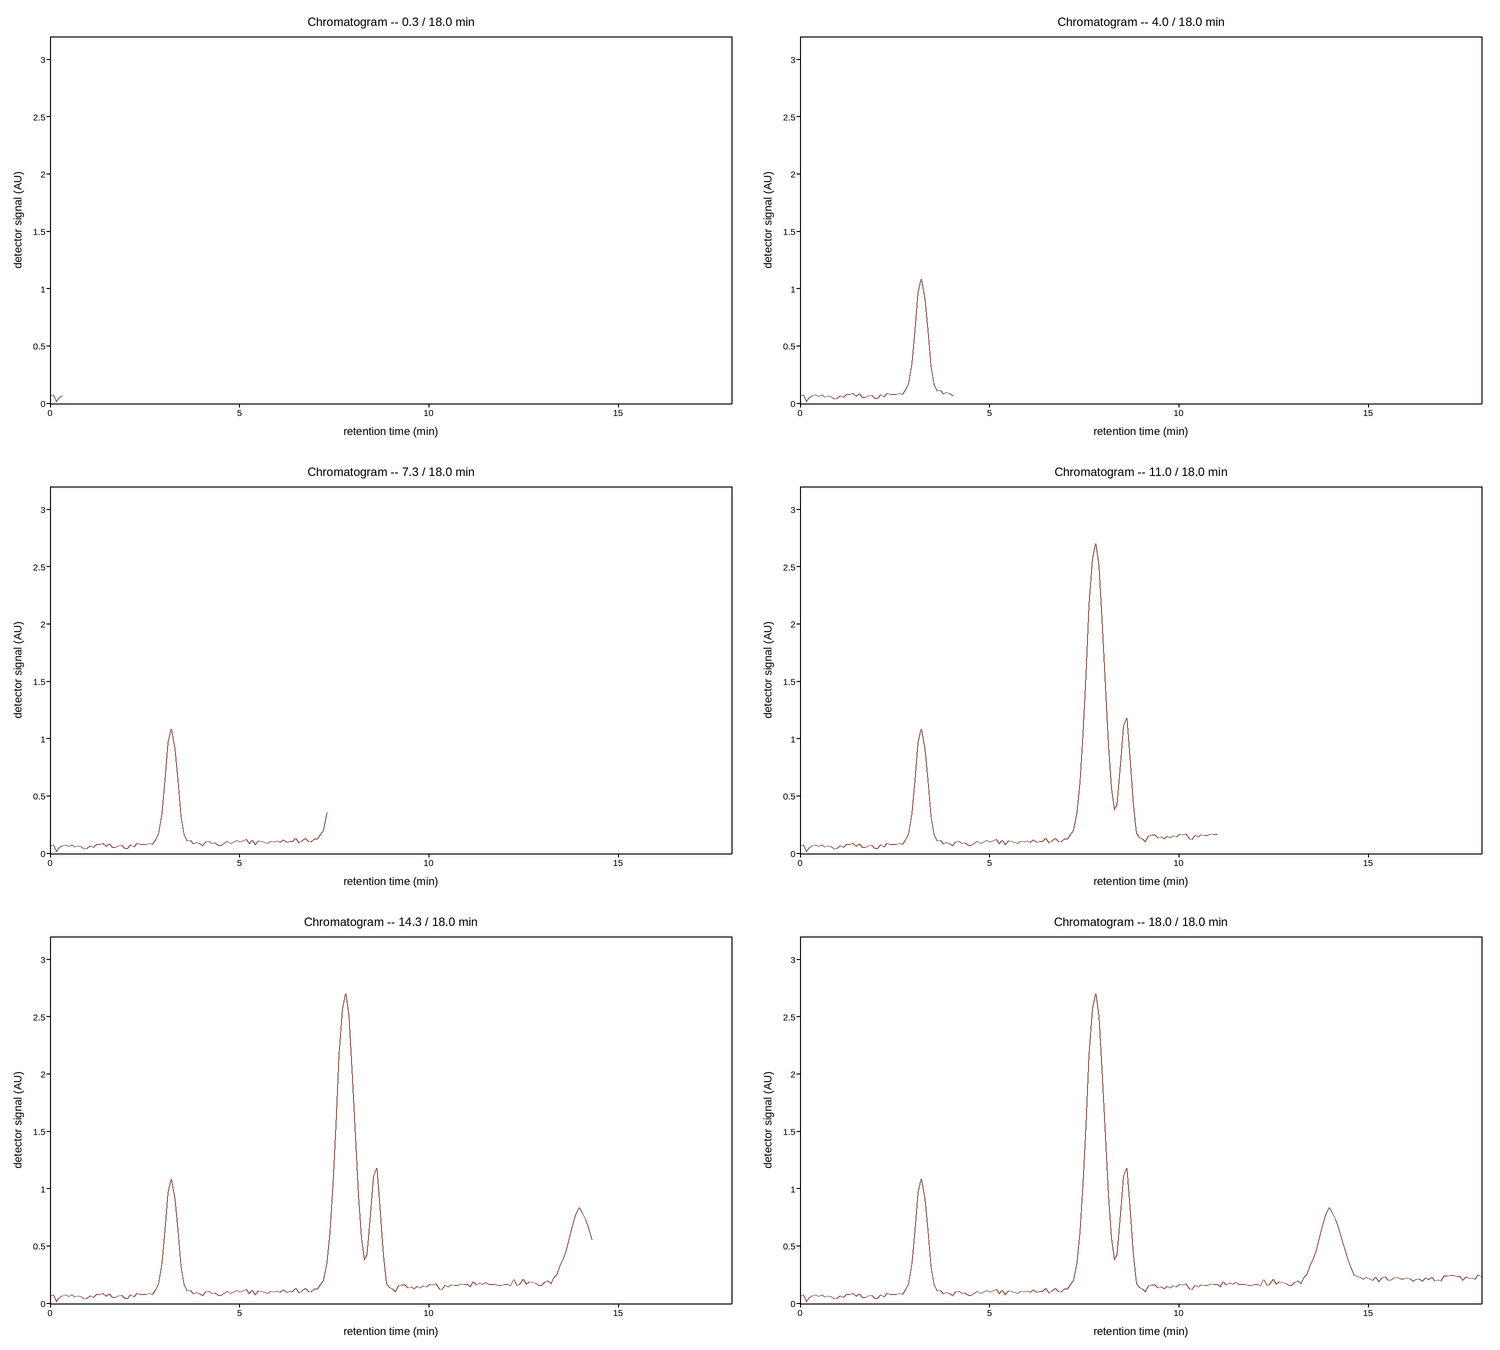
An HPLC or GC run is read out continuously as the sample elutes, so the trace grows one retention-time step at a time – the detector’s y range is fixed by its hardware, but there’s no telling in advance how long the run needs to be, so x keeps growing until the run is stopped. Once a peak’s apex has clearly passed (the signal has risen, then fallen back by a margin), it gets labeled right where it was found, rather than waiting for the whole run to finish and post-processing it.
The code below is exactly what you’d write against the real
plotpress.qt.LiveArtist: a callback that receives the newest few
samples from the detector and pushes them to the plot, fed by a loop
simulating the detector’s own sample clock. Only
read_detector_samples() is meant to be replaced, with your own
instrument call – except the peak-labeling block, which checks the
buffered signal against known peak locations only because this is a
simulation that has to generate its own “true” chromatogram; a real
integrator would run genuine peak-finding (e.g. scipy.signal.find_peaks)
against the live buffer instead.
import numpy as np
import plotpress


RUN_LENGTH_MIN = 18.0   # the detector's own fixed run window

fig, ax = plotpress.subplots(figsize=(7.5, 4.5))
trace_line = LiveArtist(ax, color="#8c564b", linewidth=1.2)
t_buf, y_buf = [], []
labeled = []   # retention times already annotated


def on_new_samples(ts, ys):
    """Called once per acquisition tick with the newest samples from the
    detector -- push them into the running trace and check whether any
    peak's apex has now clearly passed.
    """
    t_buf.extend(ts)
    y_buf.extend(ys)
    t, y = np.array(t_buf), np.array(y_buf)

    trace_line.update(t, y)
    ax.set_xlim(0, RUN_LENGTH_MIN)   # cla() inside update() wiped this -- fixed run window
    ax.set_ylim(0, 3.2)
    ax.set_xlabel("retention time (min)"); ax.set_ylabel("detector signal (AU)")
    ax.set_title(f"Chromatogram -- {t[-1]:.1f} / {RUN_LENGTH_MIN:.1f} min")

    # A peak has "passed" once the signal has climbed at least 0.3 AU above
    # a nearby earlier point and then dropped back down by the same margin
    # -- simple enough to run every frame, exactly like an online integrator
    # would flag it during the run rather than after. (Checked against the
    # simulation's own known peak centers -- a real integrator would find
    # these from the buffered signal itself, not a list of true answers.)
    if len(t) > 10:
        for center, height, width in PEAKS:
            if center in labeled or center > t[-1]:
                continue
            past_apex_idx = np.searchsorted(t, center + 1.5 * width)
            if past_apex_idx < len(y) and t[past_apex_idx - 1] > center:
                apex_i = np.argmax(y[:past_apex_idx])
                if y[apex_i] - y[past_apex_idx - 1] > 0.2 * height:
                    labeled.append(center)
                    ax.annotate(f"{center:.1f} min", (t[apex_i], y[apex_i]),
                                xytext=(t[apex_i] + 0.3, y[apex_i] + 0.25),
                                color="#d62728")

    fig.tight_layout()


# ---------------------------------------------------------------------------
# Data acquisition -- replace this with your own detector driver. Every-
# thing above only needs (ts, ys) handed to on_new_samples() as they
# arrive.
# ---------------------------------------------------------------------------
rng = np.random.default_rng(6)
PEAKS = [(3.2, 1.0, 0.15), (7.8, 2.6, 0.22), (8.6, 1.1, 0.12), (14.0, 0.6, 0.30)]
t_full = np.linspace(0, RUN_LENGTH_MIN, 220)


def _true_chromatogram(t):
    s = 0.05 + 0.01 * t
    for center, height, width in PEAKS:
        s = s + height * np.exp(-((t - center) ** 2) / (2 * width ** 2))
    return s


true_signal = _true_chromatogram(t_full) + 0.015 * rng.standard_normal(t_full.shape)
SAMPLES_PER_TICK = 5


def read_detector_samples(lo, hi):
    """Stand-in for the detector reporting its newest samples."""
    return t_full[lo:hi], true_signal[lo:hi]


for lo in range(0, len(t_full), SAMPLES_PER_TICK):
    hi = min(lo + SAMPLES_PER_TICK, len(t_full))
    on_new_samples(*read_detector_samples(lo, hi))
Total running time of the script: (0 minutes 5.178 seconds)