Note
Go to the end to download the full example code.
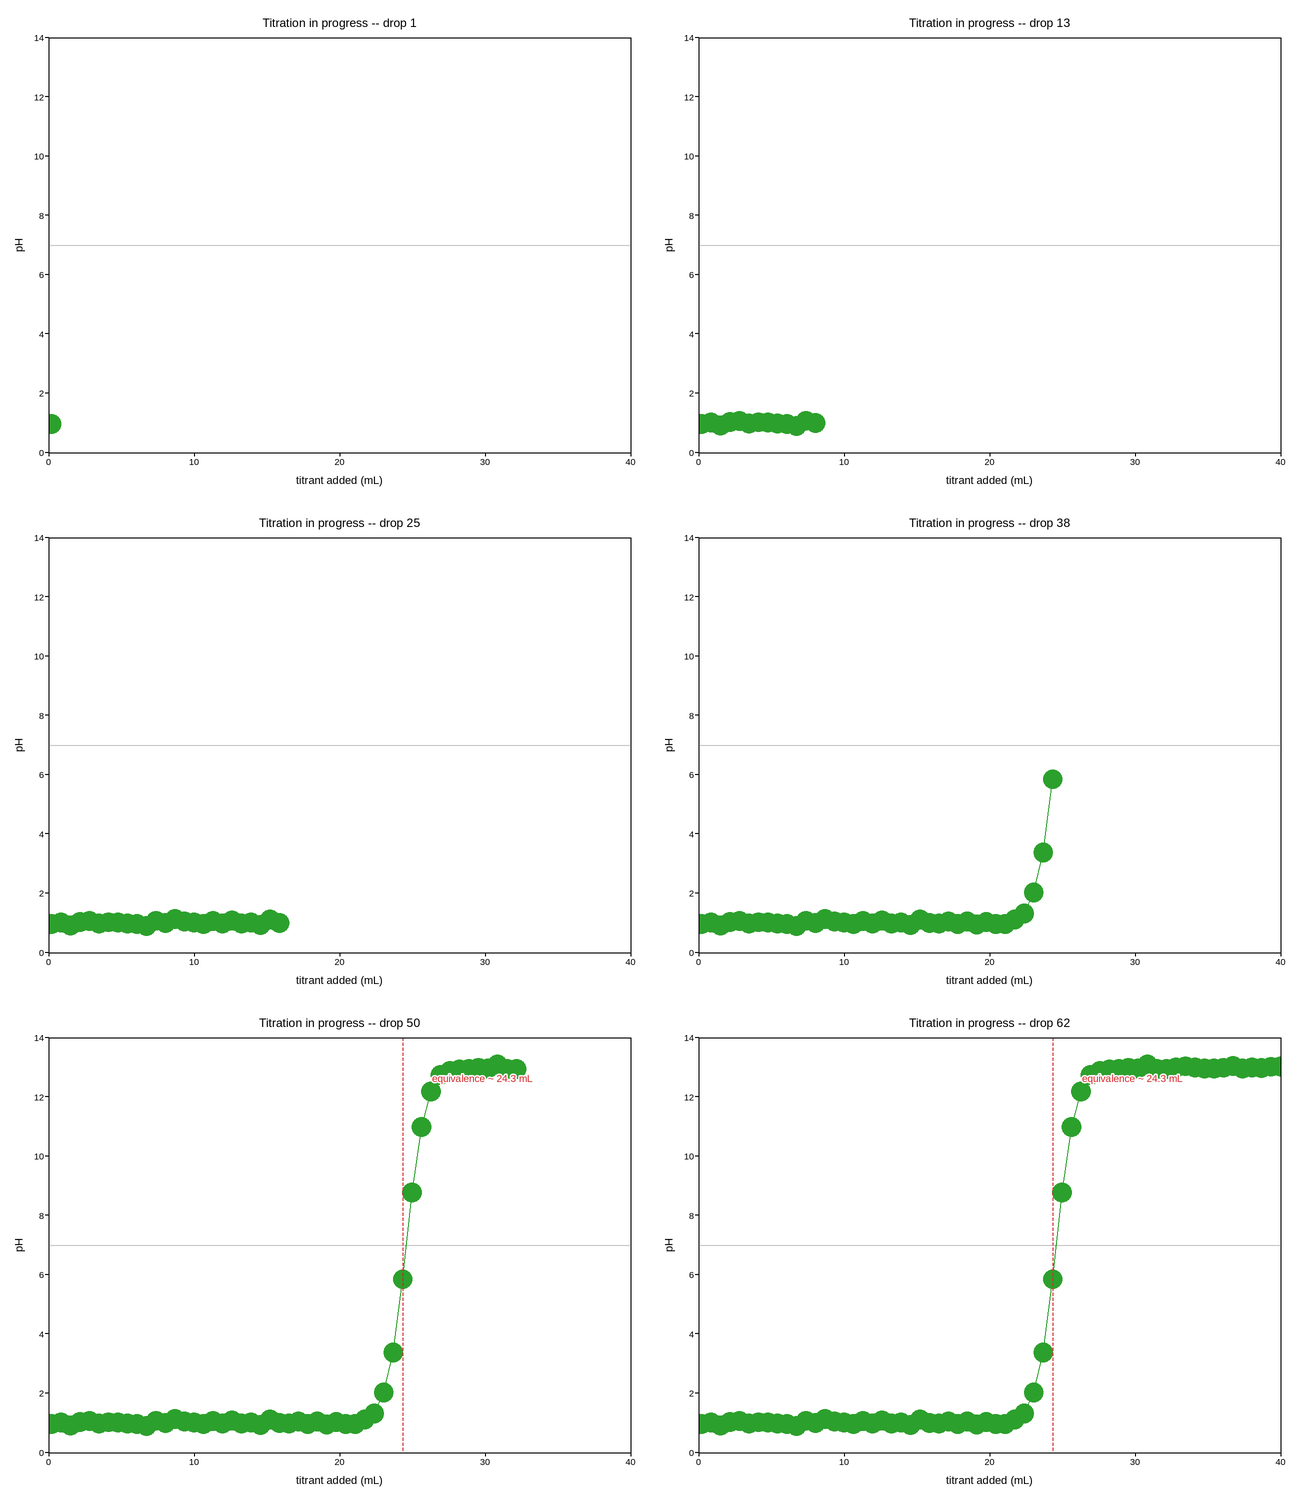
Titration curve, marking the equivalence point live
A pH titration is added drop by drop, so the x axis (volume of titrant
added) only ever grows – the same shape as the acquisition-pattern
gallery’s growing-x-axis example, but with two lab-specific details: y
is bounded to the pH scale regardless of how far x grows, and once
enough of the curve is in, the steepest point (the equivalence point) can be
found and annotated live rather than only after the run finishes.
The code below is exactly what you’d write against the real
plotpress.qt.LiveArtist: a callback that receives one drop at a time
and pushes it to the plot, fed by a loop simulating a titrator. Only
read_next_drop() is meant to be replaced, with your own instrument
call.
import numpy as np
import plotpress


fig, ax = plotpress.subplots(figsize=(6.5, 5))
curve = LiveArtist(ax, color="#2ca02c", linewidth=1.0)
vs, phs = [], []
equiv_found_at = None


def on_new_drop(v, ph):
    """Called once per drop added -- push the new (volume, pH) reading and
    redraw, checking whether enough of the curve is in yet to locate and
    mark the equivalence point.
    """
    global equiv_found_at
    vs.append(v)
    phs.append(ph)

    curve.update(np.array(vs), np.array(phs))
    ax.scatter(vs, phs, color="#2ca02c", s=14)   # cla() inside update() wiped this
    ax.set_xlim(0, 40); ax.set_ylim(0, 14)
    ax.axhline(7.0, color="#888888", linestyle=":", linewidth=1.0)
    ax.set_xlabel("titrant added (mL)"); ax.set_ylabel("pH")
    ax.set_title(f"Titration in progress -- drop {len(vs)}")

    # Once there's enough curve to have crossed the steepest section, find
    # and mark it -- exactly the kind of "annotate as it's discovered"
    # detail a live plot can do that a pre-rendered static curve can't.
    if len(vs) >= 6:
        d_ph = np.gradient(np.array(phs), np.array(vs))
        peak = int(np.argmax(np.abs(d_ph)))
        if np.abs(d_ph[peak]) > 1.5 and vs[peak] not in (vs[0], vs[-1]):
            equiv_found_at = vs[peak]
    if equiv_found_at is not None:
        ax.axvline(equiv_found_at, color="#d62728", linestyle="--", linewidth=1.2)
        ax.annotate(f"equivalence ~ {equiv_found_at:.1f} mL", (equiv_found_at, 11.0),
                    xytext=(equiv_found_at + 2.0, 12.5), color="#d62728")

    fig.tight_layout()


# ---------------------------------------------------------------------------
# Data acquisition -- replace this with your own titrator/pH meter driver.
# Everything above only needs a (volume, pH) reading handed to
# on_new_drop() as each drop is added.
# ---------------------------------------------------------------------------
TRUE_EQUIV_ML = 24.6
rng = np.random.default_rng(9)
N_DROPS = 62
drop_volumes = np.linspace(0.2, 40.0, N_DROPS)


def read_next_drop(volume_ml):
    """Stand-in for the pH meter reporting a reading after this drop --
    a sigmoid curve for a strong-acid/strong-base titration, plus noise.
    """
    ph = 7.0 + 6.0 * np.tanh((volume_ml - TRUE_EQUIV_ML) / 1.3)
    return ph + 0.05 * rng.standard_normal()


for volume_ml in drop_volumes:
    on_new_drop(volume_ml, read_next_drop(volume_ml))
Total running time of the script: (0 minutes 7.001 seconds)