Note
Go to the end to download the full example code.
Spectrum analyzer sweep, with max-hold
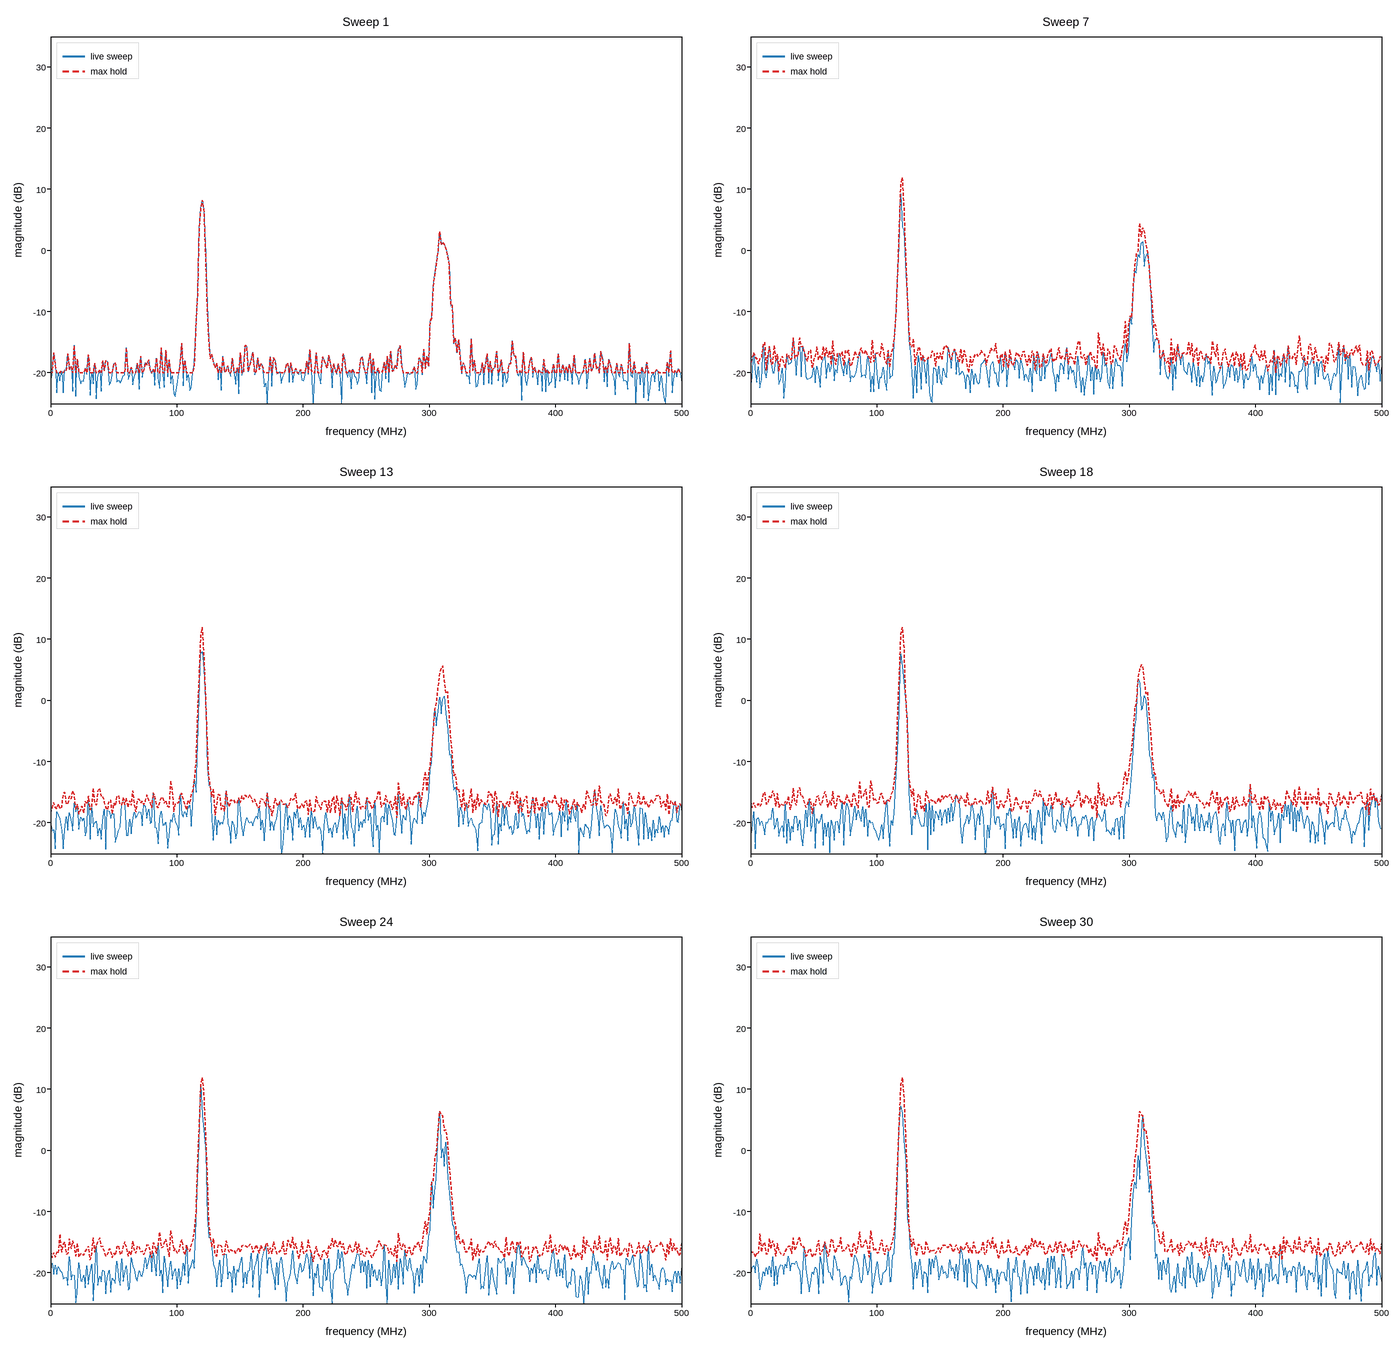
A spectrum analyzer’s trace isn’t cumulative – each sweep replaces the previous one outright, since it’s measuring the spectrum right now, not accumulating history. The “max hold” trace most analyzers offer alongside it is the exception: a second, independent line that only ever moves up, tracking the highest magnitude seen at each frequency across every sweep so far.
The code below is exactly what you’d write against the real
plotpress.qt.LiveArtist: a callback that receives one finished sweep at
a time and pushes it to the plot, fed by a loop simulating the analyzer’s
own sweep engine. Only read_next_sweep() is meant to be replaced, with
your own instrument call – with one detail worth calling out along the
way: update() clears the whole axes each call, so a second series
that isn’t the one wrapped in it – max-hold here – has to be redrawn
manually every time, after update() returns, not handed to a second
LiveArtist on the same axes.
import numpy as np
import plotpress


freq = np.linspace(0, 500, 400)   # MHz -- the analyzer's own fixed sweep range
NOISE_FLOOR_DB = -20.0

fig, ax = plotpress.subplots(figsize=(7, 4.5))
sweep_line = LiveArtist(ax, color="#1f77b4", linewidth=1.0, label="live sweep")
max_hold = np.full_like(freq, NOISE_FLOOR_DB)
sweep_count = 0


def on_new_sweep(trace):
    """Called once per completed sweep -- update the live trace, fold it
    into the running max-hold, and redraw both.
    """
    global max_hold, sweep_count
    sweep_count += 1
    max_hold = np.maximum(max_hold, trace)

    sweep_line.update(freq, trace)
    ax.plot(freq, max_hold, color="#d62728", linewidth=1.4, linestyle="--",
           label="max hold")   # cla() inside update() wiped this -- redraw it every call
    ax.set_ylim(NOISE_FLOOR_DB - 5, 35)
    ax.set_xlabel("frequency (MHz)"); ax.set_ylabel("magnitude (dB)")
    ax.set_title(f"Sweep {sweep_count}")
    ax.legend(loc="upper left")
    fig.tight_layout()


# ---------------------------------------------------------------------------
# Data acquisition -- replace this with your own analyzer driver. Every-
# thing above only needs a trace (one magnitude per freq bin) handed to
# on_new_sweep() as each sweep completes.
# ---------------------------------------------------------------------------
rng = np.random.default_rng(4)
PEAKS = [(120.0, 28.0, 3.0), (310.0, 22.0, 6.0)]   # (freq, height_dB, width_MHz)
N_SWEEPS = 30


def read_next_sweep():
    """Stand-in for the analyzer completing one sweep across its fixed
    frequency range.
    """
    trace = np.full_like(freq, NOISE_FLOOR_DB) + 2.0 * rng.standard_normal(freq.shape)
    for f0, height, width in PEAKS:
        lobe = np.exp(-((freq - f0) ** 2) / (2 * width ** 2))
        trace += height * lobe + 0.4 * rng.standard_normal(freq.shape) * lobe
    return trace


for _ in range(N_SWEEPS):
    on_new_sweep(read_next_sweep())
Total running time of the script: (0 minutes 3.542 seconds)