Note
Go to the end to download the full example code.
qPCR amplification curves, several wells at once
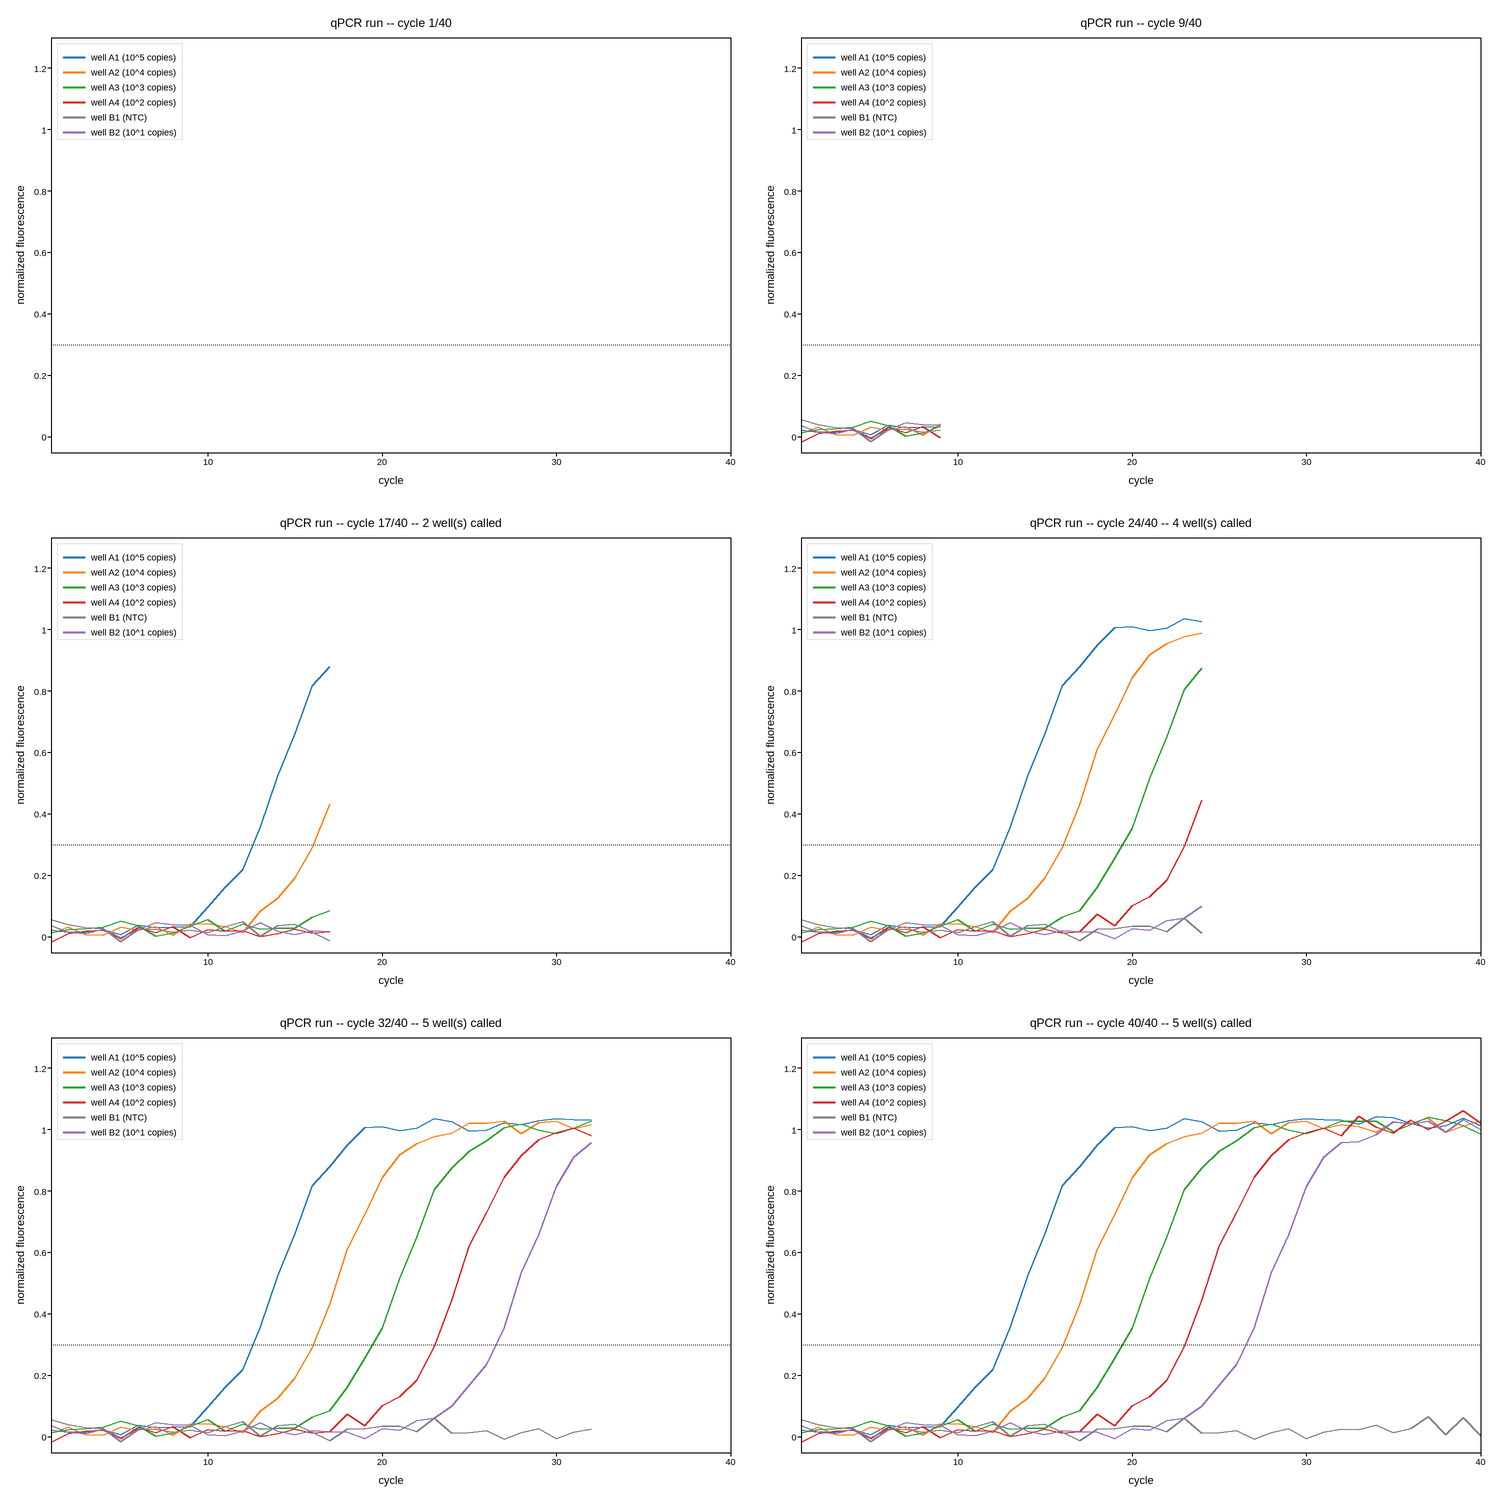
A qPCR run reads out one cycle at a time across every well in the plate simultaneously, not one well to completion before the next – so unlike the single-trace examples elsewhere in this gallery, each update here grows several lines together on one axes. The cycle count is fixed by the protocol (40 cycles), so only the data within that known window grows, not the window itself; a threshold line marks the fluorescence level used to read off each well’s Ct (cycle threshold) the moment its curve crosses it.
The code below is exactly what you’d write for real: a callback that
receives one cycle’s readings across every well at once and redraws, fed by
a loop simulating the plate reader. Only read_next_cycle() is meant to
be replaced, with your own instrument call. plotpress.qt.LiveArtist
wraps exactly one artist per axes, so it doesn’t fit several genuinely
independent, simultaneously-growing lines the way it does the single-trace
examples elsewhere in this gallery – with several real lines to manage at
once, the honest turn-key version is to manage the redraw directly the same
way this does (ax.cla(), then one ax.plot() per well), not to force
it through an artist wrapper built for one series at a time.
import numpy as np
import plotpress


N_CYCLES = 40          # fixed by the protocol
THRESHOLD = 0.3
WELL_NAMES = [
    "well A1 (10^5 copies)", "well A2 (10^4 copies)", "well A3 (10^3 copies)",
    "well A4 (10^2 copies)", "well B1 (NTC)", "well B2 (10^1 copies)",
]
WELL_COLORS = ["#1f77b4", "#ff7f0e", "#2ca02c", "#d62728", "#7f7f7f", "#9467bd"]

fig, ax = plotpress.subplots(figsize=(7.5, 5))
cycles_seen = []
traces = {name: [] for name in WELL_NAMES}
ct_called = {}


def on_new_cycle(cycle_n, readings):
    """Called once per cycle with every well's reading for that cycle,
    handed as ``{well_name: fluorescence}``.
    """
    cycles_seen.append(cycle_n)
    for name in WELL_NAMES:
        traces[name].append(readings[name])
        if name not in ct_called and readings[name] >= THRESHOLD:
            ct_called[name] = cycle_n

    ax.cla()
    x = np.array(cycles_seen)
    for name, color in zip(WELL_NAMES, WELL_COLORS):
        ax.plot(x, traces[name], color=color, label=name, linewidth=1.3)
    ax.axhline(THRESHOLD, color="#333333", linestyle=":", linewidth=1.0)
    ax.set_xlim(1, N_CYCLES)
    ax.set_ylim(-0.05, 1.3)
    ax.set_xlabel("cycle"); ax.set_ylabel("normalized fluorescence")
    ax.set_title(f"qPCR run -- cycle {cycle_n}/{N_CYCLES}"
                + (f" -- {len(ct_called)} well(s) called" if ct_called else ""))
    ax.legend(loc="upper left", ncol=1)
    fig.tight_layout()


# ---------------------------------------------------------------------------
# Data acquisition -- replace this with your own plate reader driver. Every-
# thing above only needs a cycle number and a {well_name: reading} dict
# handed to on_new_cycle() as each cycle completes.
# ---------------------------------------------------------------------------
rng = np.random.default_rng(2)
# Six wells with different starting template concentrations -> different Ct.
WELL_CT = {
    "well A1 (10^5 copies)": 14.0,
    "well A2 (10^4 copies)": 17.5,
    "well A3 (10^3 copies)": 21.0,
    "well A4 (10^2 copies)": 24.5,
    "well B1 (NTC)": None,          # no-template control -- never amplifies
    "well B2 (10^1 copies)": 28.0,
}


def read_next_cycle(cycle_n):
    """Stand-in for the plate reader reporting every well's fluorescence
    for this cycle.
    """
    readings = {}
    for name, ct in WELL_CT.items():
        if ct is None:
            readings[name] = 0.02 * rng.standard_normal() + 0.02
        else:
            readings[name] = (0.02 + 1.0 / (1.0 + np.exp(-(cycle_n - ct) / 1.6))
                              + 0.015 * rng.standard_normal())
    return readings


for cycle_n in range(1, N_CYCLES + 1):
    on_new_cycle(cycle_n, read_next_cycle(cycle_n))
Total running time of the script: (0 minutes 5.542 seconds)