Note
Go to the end to download the full example code.
AFM/STM topography raster scan
A scanning-probe microscope builds its image the way a CRT does: the tip sweeps the fast axis (x) pixel by pixel, then steps the slow axis (y) and sweeps back – the same fixed-grid, fixed-scale, point-by-point order as the acquisition-pattern gallery’s raster example, just with physical units (nm) and a surface topography stand-in (a grain boundary with a step edge) instead of an abstract field.
The code below is exactly what you’d write against the real
plotpress.qt.LiveArtist: a callback that receives whatever new pixels
the tip reported since the last tick and pushes the updated image to the
plot, fed by a loop simulating the scan controller. Only
read_next_pixels() is meant to be replaced, with your own instrument
call.
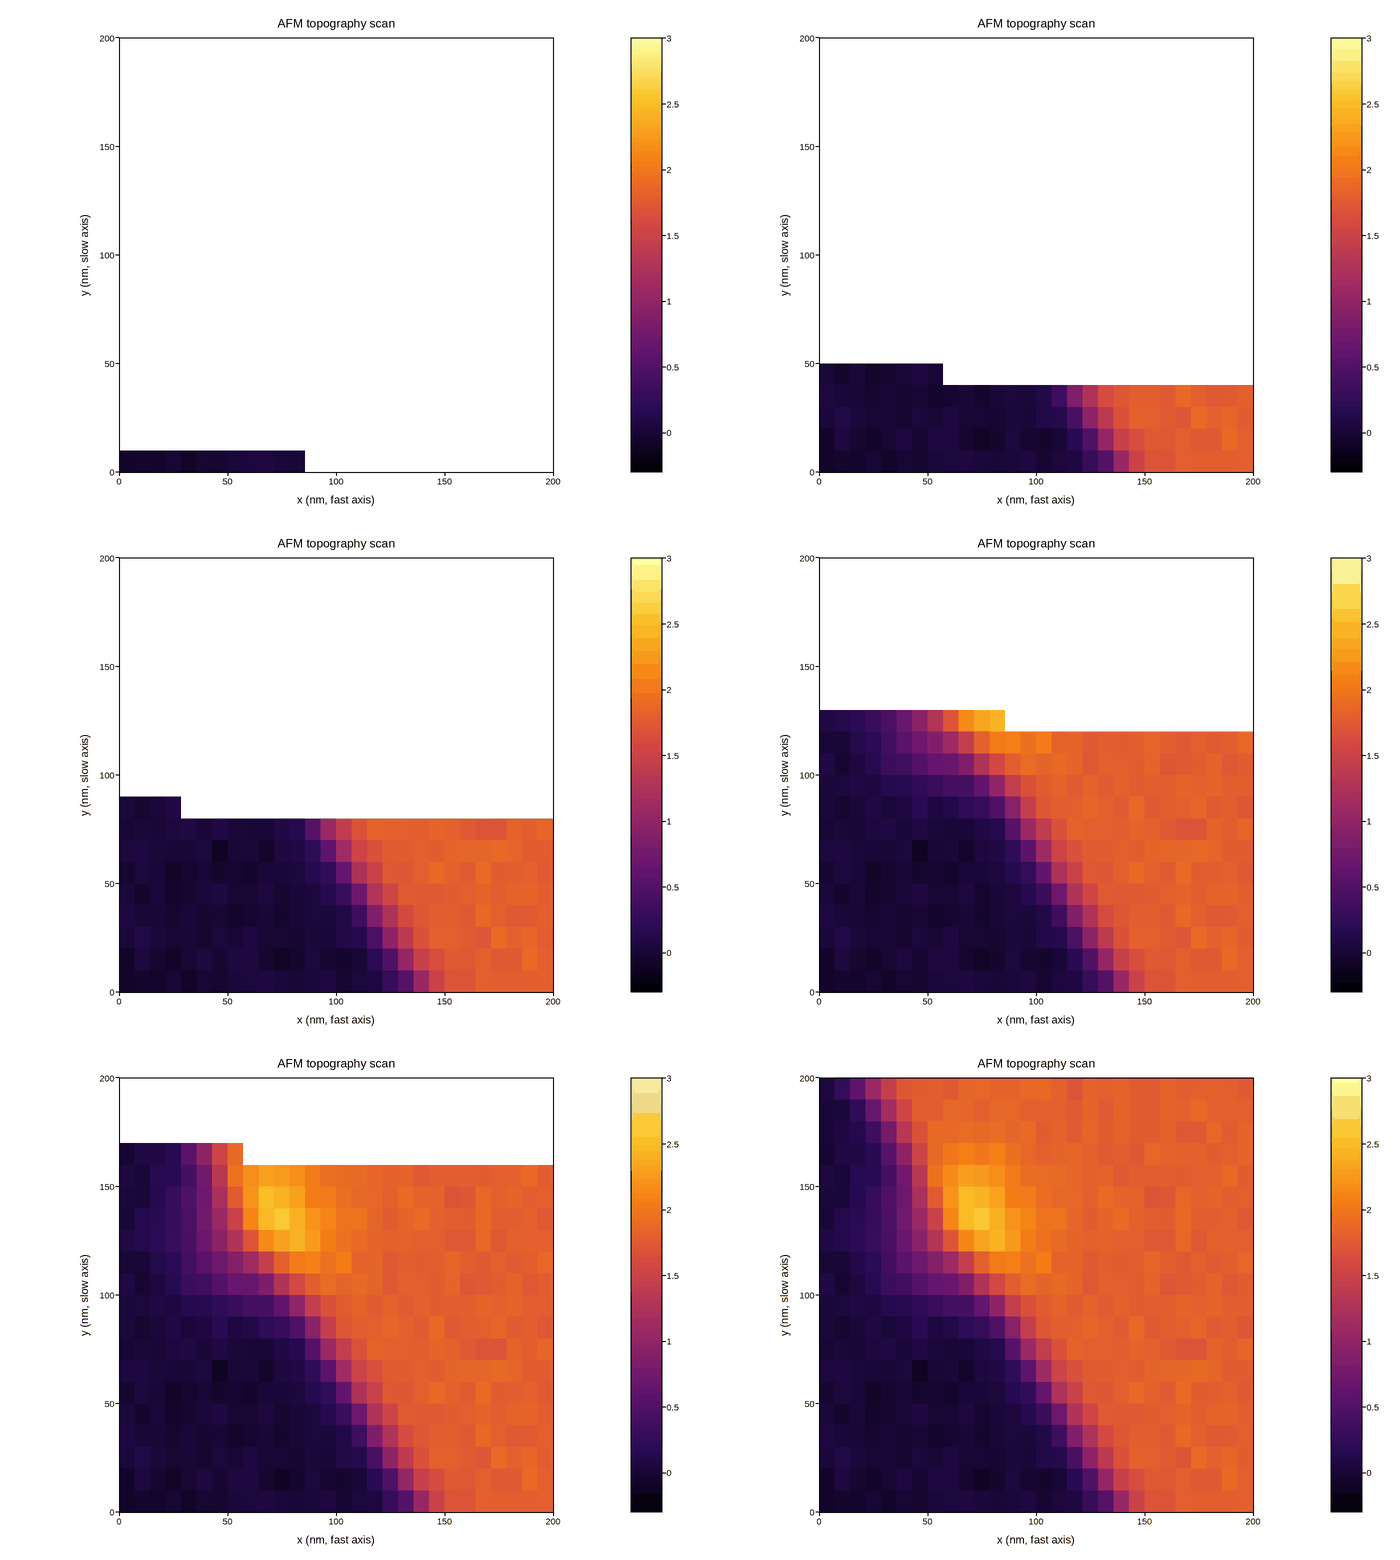
import numpy as np
import plotpress


NY, NX = 20, 28                    # slow axis (y), fast axis (x) pixel counts
FIELD_NM = 200.0                   # scan size, nm -- fixed by the scan setup
VMIN, VMAX = -0.3, 3.0             # the instrument's own known height range

gx = np.linspace(0, FIELD_NM, NX + 1)
gy = np.linspace(0, FIELD_NM, NY + 1)

fig, ax = plotpress.subplots(figsize=(7, 5.2))
grid = np.full((NY, NX), np.nan)

# One-time setup: draw the still-empty image so the axes decorations and
# colorbar are in place before any live updates start.
m0 = ax.pcolormesh(gx, gy, grid, cmap="inferno", vmin=VMIN, vmax=VMAX)
ax.set_aspect("equal")
ax.set_xlabel("x (nm, fast axis)"); ax.set_ylabel("y (nm, slow axis)")
ax.set_title("AFM topography scan")
fig.colorbar(m0, ax=ax)
fig.tight_layout()

image = LiveArtist(ax, cmap="inferno", vmin=VMIN, vmax=VMAX)


def on_new_pixels(pixels):
    """Called once per acquisition tick with whatever ``(row, col, height)``
    pixels the tip reported since the last one.
    """
    for r, c, h in pixels:
        grid[r, c] = h
    image.update(gx, gy, grid)
    ax.set_aspect("equal")             # cla() inside update() wiped these
    ax.set_xlabel("x (nm, fast axis)"); ax.set_ylabel("y (nm, slow axis)")
    ax.set_title("AFM topography scan")
    fig.tight_layout()


# ---------------------------------------------------------------------------
# Data acquisition -- replace this with your own scan controller. Every-
# thing above only needs a list of (row, col, height) pixels handed to
# on_new_pixels() as they're measured.
# ---------------------------------------------------------------------------
rng = np.random.default_rng(8)
cols, rows = np.meshgrid(np.arange(NX), np.arange(NY))
x_nm = (cols + 0.5) * FIELD_NM / NX
y_nm = (rows + 0.5) * FIELD_NM / NY

# A step edge (grain boundary) plus a rounded hillock -- both common AFM
# topography features -- and a little scan noise.
STEP_HEIGHT_NM = 1.8
step = STEP_HEIGHT_NM / (1.0 + np.exp(-(x_nm + 0.6 * y_nm - 140.0) / 6.0))
hillock = 1.1 * np.exp(-((x_nm - 60.0) ** 2 + (y_nm - 130.0) ** 2) / (2 * 22.0 ** 2))
height_nm = step + hillock + 0.04 * rng.standard_normal((NY, NX))

# Fast axis first (x, one pixel at a time), then step the slow axis (y).
order = [(r, c) for r in range(NY) for c in range(NX)]
PIXELS_PER_TICK = 12


def read_next_pixels(lo, hi):
    """Stand-in for the tip reporting whichever pixels it measured this
    tick, in raster order.
    """
    return [(r, c, float(height_nm[r, c])) for r, c in order[lo:hi]]


for lo in range(0, len(order), PIXELS_PER_TICK):
    hi = min(lo + PIXELS_PER_TICK, len(order))
    on_new_pixels(read_next_pixels(lo, hi))
Total running time of the script: (0 minutes 6.242 seconds)