Note
Go to the end to download the full example code.
Bioreactor dashboard, four channels at once
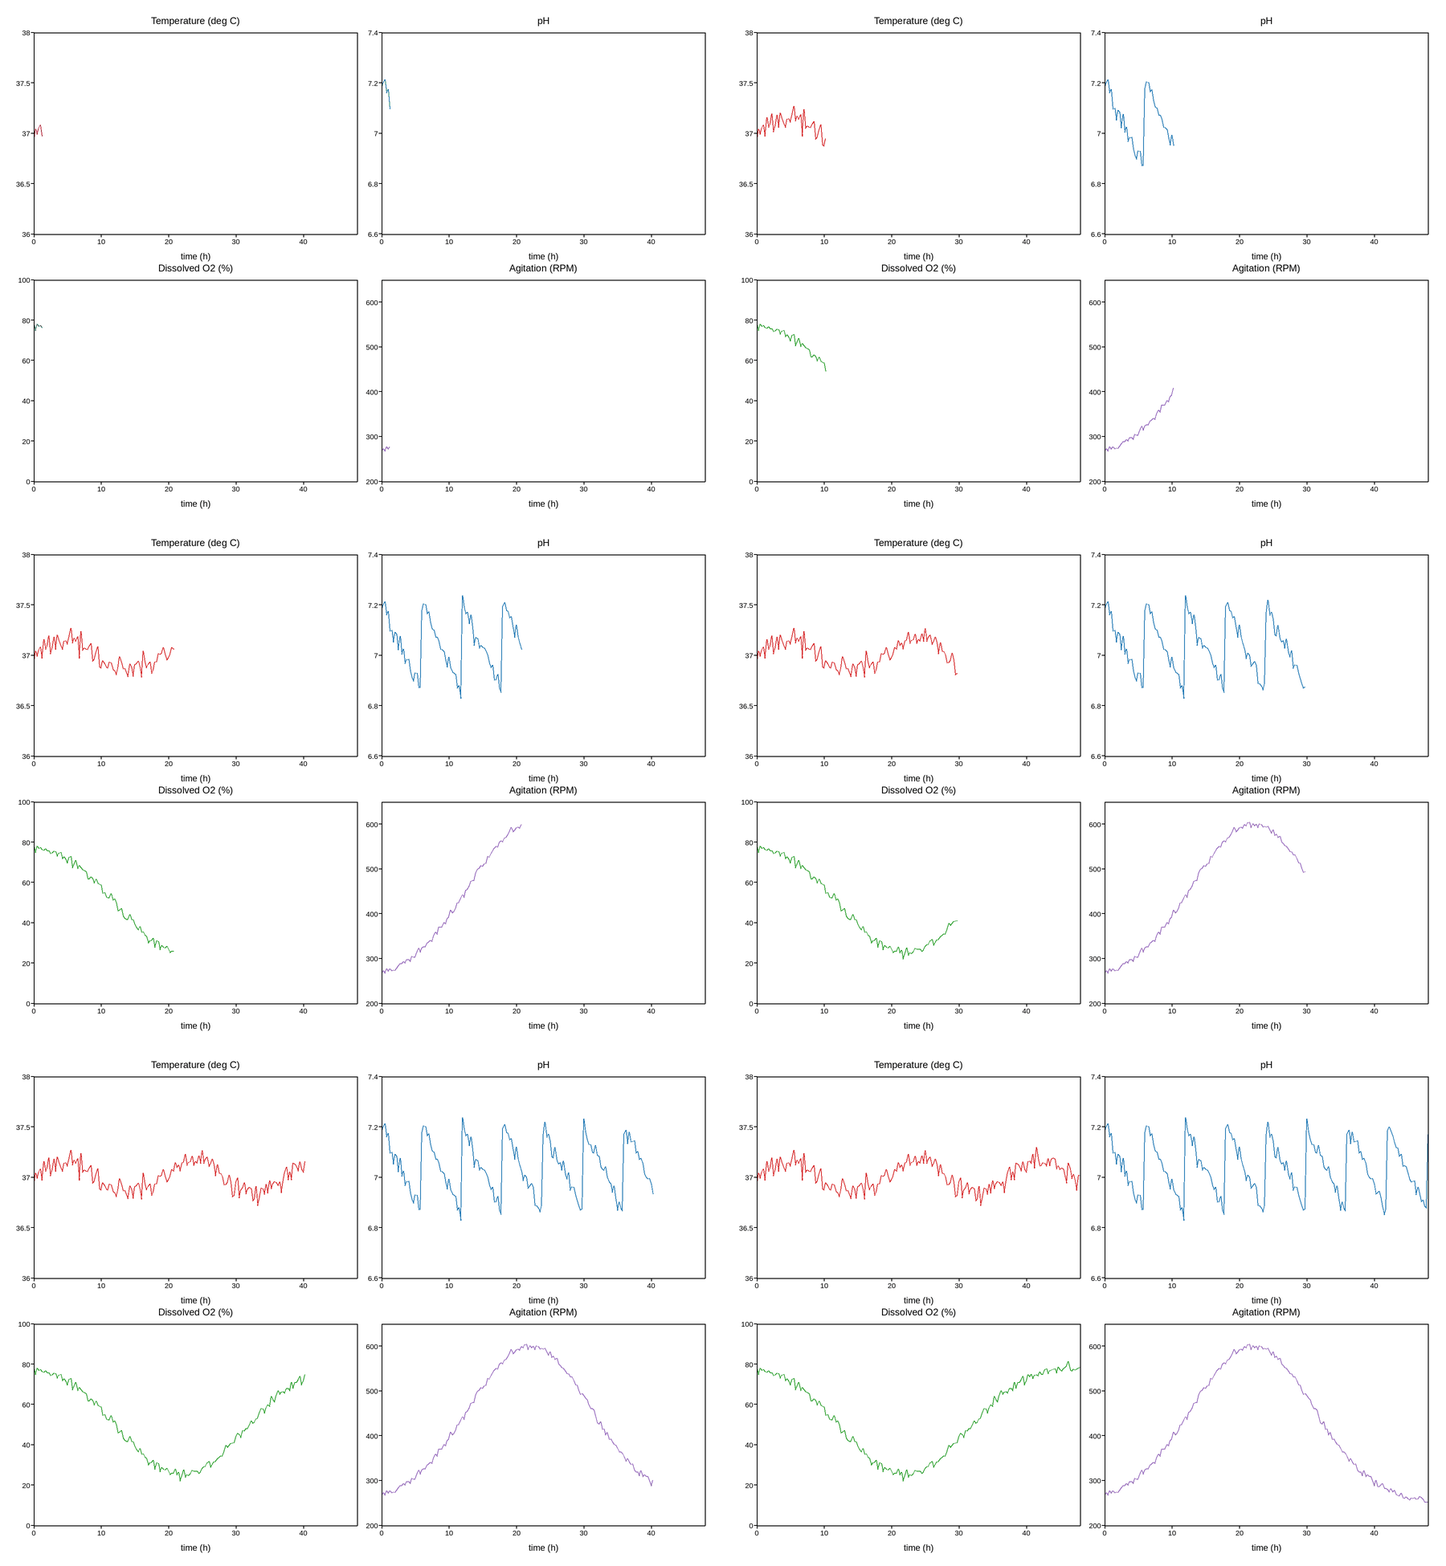
A bioreactor’s control system logs several channels together – temperature,
pH, dissolved oxygen, agitation speed – each with its own physically
meaningful range and its own control behavior (a tight setpoint band for
temperature, a sawtooth for pH as base is dosed in to correct drift, a dip
and recovery for DO as the culture’s oxygen demand peaks then eases). A real
dashboard drives one LiveArtist per panel, all four updating together
from the same sweep loop, on a single PlotPressWidget/figure – the
Qt-side shape the test suite’s own multi-axes check exercises, and unlike
qPCR amplification curves, several wells at once or Cyclic voltammetry, cycle over cycle,
each channel gets its own axes, so there’s no z-ordering conflict to work
around: four independent LiveArtists, one per panel.
The code below is exactly what you’d write against the real
plotpress.qt.LiveArtist: a callback that receives one reading per
channel and pushes each to its own panel, fed by a loop simulating the
reactor’s own logger. Only read_next_reading() is meant to be replaced,
with your own instrument call.
import numpy as np
import plotpress


N_HOURS = 48   # the run's planned duration -- fixes every panel's x window

CHANNELS = [
    ("Temperature", "#d62728", (36.0, 38.0), "deg C"),
    ("pH", "#1f77b4", (6.6, 7.4), ""),
    ("Dissolved O2", "#2ca02c", (0, 100), "%"),
    ("Agitation", "#9467bd", (200, 650), "RPM"),
]

fig, axes = plotpress.subplots(2, 2, figsize=(9, 6.5))
artists = {}
for (name, color, ylim, unit), ax in zip(CHANNELS, axes.flat):
    artists[name] = (LiveArtist(ax, color=color, linewidth=1.2), ax, ylim, unit)

t_seen = []
readings = {name: [] for name, *_ in CHANNELS}


def on_new_readings(ts, values_list):
    """Called once per logger tick with whatever new ``(t, {channel:
    value})`` readings came in since the last one -- push them all into
    their panels and redraw once.
    """
    t_seen.extend(ts)
    for name, (artist, ax, ylim, unit) in artists.items():
        readings[name].extend(v[name] for v in values_list)
        artist.update(np.array(t_seen), np.array(readings[name]))
        ax.set_xlim(0, N_HOURS)   # cla() inside update() wiped this
        ax.set_ylim(*ylim)
        ax.set_title(f"{name}{f' ({unit})' if unit else ''}")
        ax.set_xlabel("time (h)")
    fig.tight_layout()


# ---------------------------------------------------------------------------
# Data acquisition -- replace this with your own reactor logger. Every-
# thing above only needs a list of times and a list of {channel_name:
# value} dicts handed to on_new_readings() as each tick's batch arrives.
# ---------------------------------------------------------------------------
rng = np.random.default_rng(15)
STEPS_PER_HOUR = 4


def read_next_reading(t):
    """Stand-in for the logger reporting one reading across all channels
    at time t."""
    # Temperature: held near a 37 C setpoint by the control loop.
    temp = 37.0 + 0.15 * np.sin(t / 3.0) + 0.06 * rng.standard_normal()
    # pH: drifts down as the culture produces acid, corrected back up in
    # steps whenever base is dosed in -- a sawtooth, not a smooth curve.
    ph = 7.2 - 0.35 * (t % 6.0) / 6.0 + 0.02 * rng.standard_normal()
    # Dissolved oxygen: drops as growth accelerates through mid-run, then
    # recovers as the cascade control raises agitation to compensate.
    growth_rate = np.exp(-((t - 22.0) ** 2) / (2 * 9.0 ** 2))
    do_pct = float(np.clip(80.0 - 55.0 * growth_rate + 1.5 * rng.standard_normal(), 5.0, 95.0))
    # Agitation: the cascade control's response to the DO dip above.
    agitation_rpm = 250.0 + 350.0 * growth_rate + 4.0 * rng.standard_normal()
    return {"Temperature": temp, "pH": ph, "Dissolved O2": do_pct, "Agitation": agitation_rpm}


STRIDE = 6
t_full = np.linspace(0, N_HOURS, N_HOURS * STEPS_PER_HOUR + 1)
for lo in range(0, len(t_full), STRIDE):
    hi = min(lo + STRIDE, len(t_full))
    ts = t_full[lo:hi]
    on_new_readings(ts, [read_next_reading(t) for t in ts])
Total running time of the script: (0 minutes 6.721 seconds)