Note
Go to the end to download the full example code.
Radio telescope beam map, serpentine scan
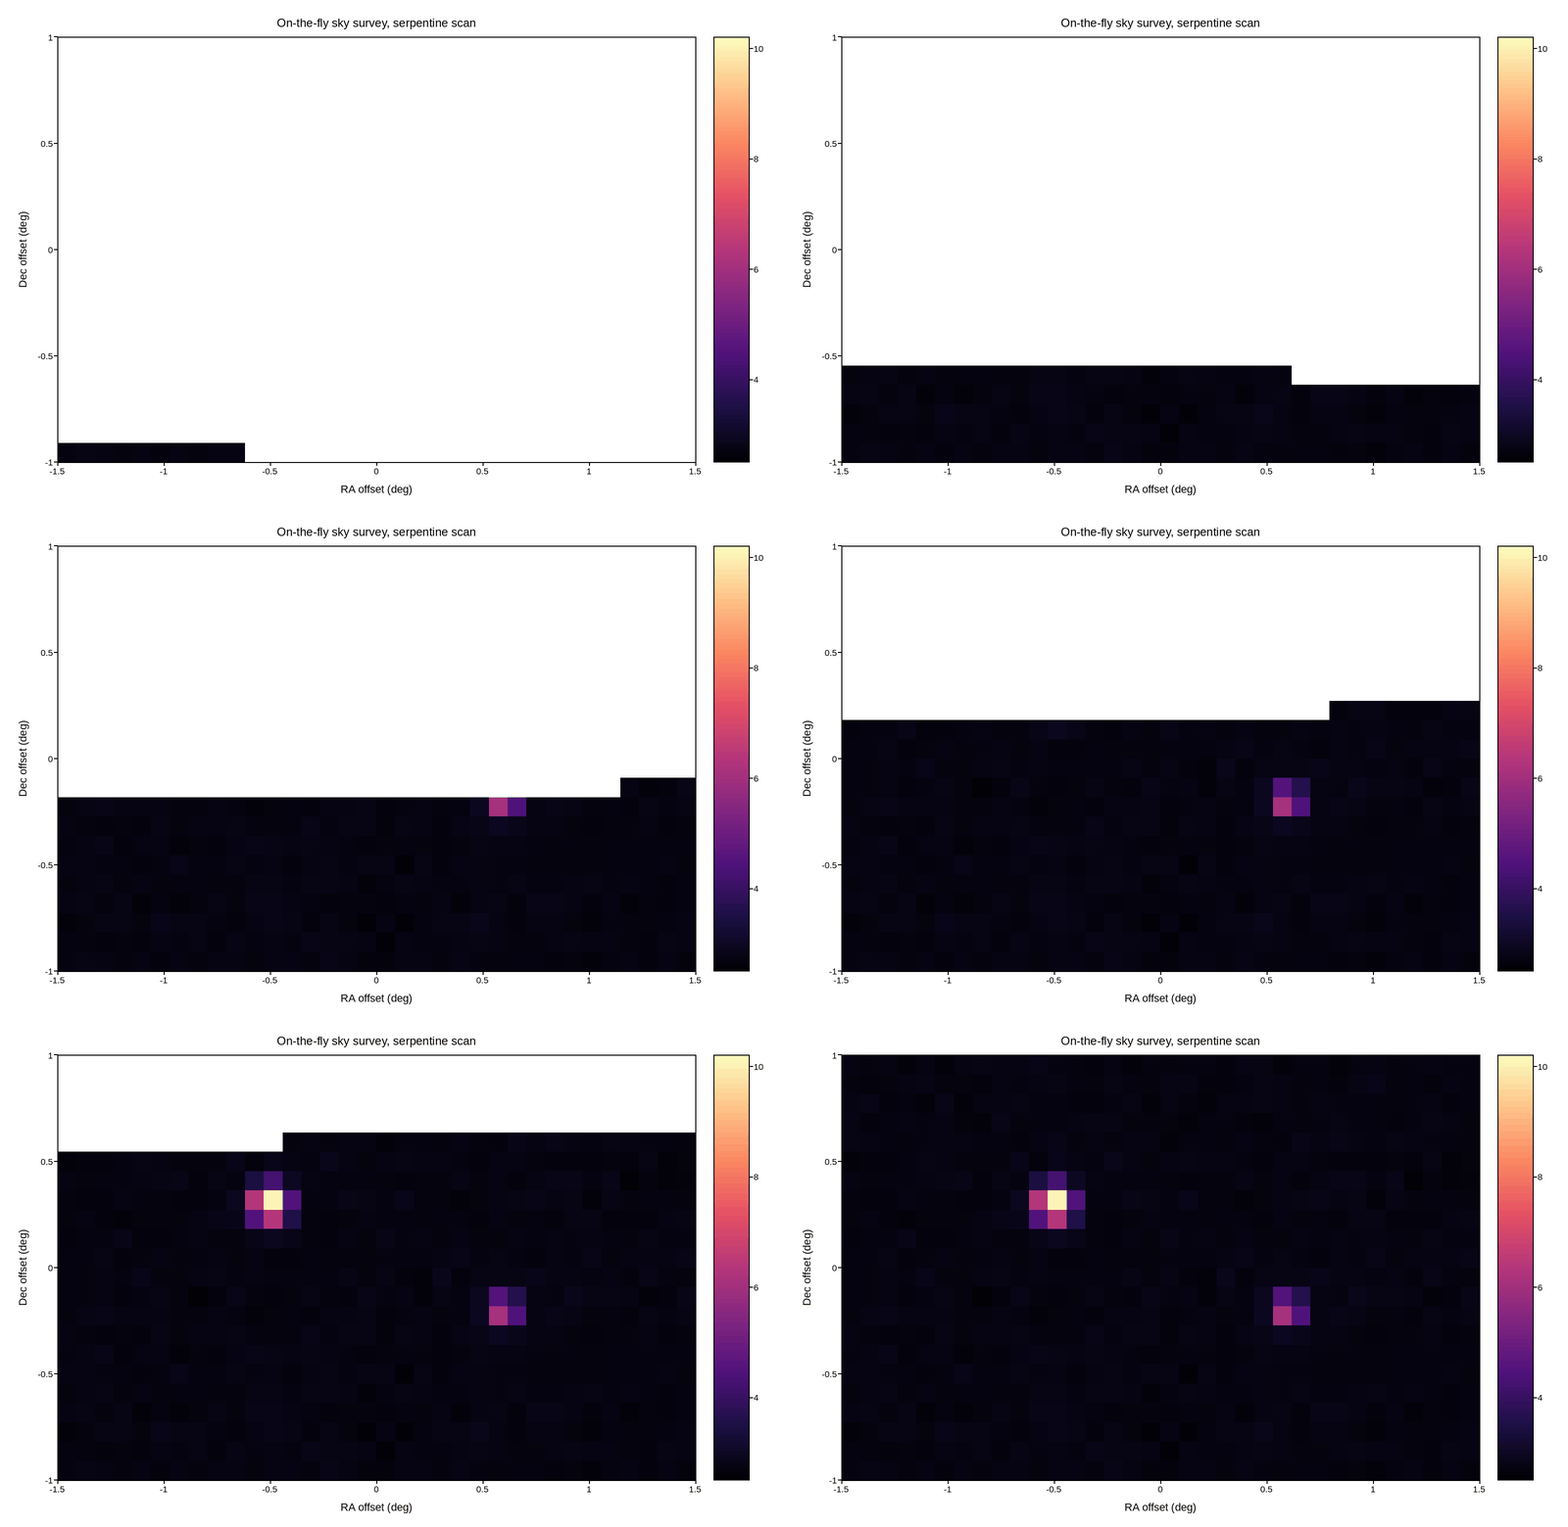
An on-the-fly sky survey doesn’t raster back to the start of each row – that would waste half the observing time slewing the dish. It scans one row left to right, steps down, then scans right to left, alternating direction every row (a “boustrophedon” or serpentine pattern) so the telescope is always integrating, never just repositioning. The grid and colour scale are both fixed by the survey plan, exactly like the acquisition-pattern gallery’s raster example – only the order pixels arrive in differs.
The code below is exactly what you’d write against the real
plotpress.qt.LiveArtist: a callback that receives whatever new pixels
the dish reported since the last tick and pushes the updated map to the
plot, fed by a loop simulating the survey controller. Only
read_next_pixels() is meant to be replaced, with your own instrument
call.
import numpy as np
import plotpress


NY, NX = 22, 34                  # declination steps, right-ascension steps
gx = np.linspace(-1.5, 1.5, NX + 1)   # degrees, RA offset
gy = np.linspace(-1.0, 1.0, NY + 1)   # degrees, Dec offset
VMIN, VMAX = 2.5, 10.2           # the receiver's own known temperature range, K

fig, ax = plotpress.subplots(figsize=(8, 5.2))
grid = np.full((NY, NX), np.nan)

# One-time setup: draw the still-empty map so the axes decorations and
# colorbar are in place before any live updates start.
m0 = ax.pcolormesh(gx, gy, grid, cmap="magma", vmin=VMIN, vmax=VMAX)
ax.set_aspect("equal")
ax.set_xlabel("RA offset (deg)"); ax.set_ylabel("Dec offset (deg)")
ax.set_title("On-the-fly sky survey, serpentine scan")
fig.colorbar(m0, ax=ax)
fig.tight_layout()

sky_map = LiveArtist(ax, cmap="magma", vmin=VMIN, vmax=VMAX)


def on_new_pixels(pixels):
    """Called once per acquisition tick with whatever ``(row, col,
    temperature)`` pixels the dish reported since the last one.
    """
    for r, c, temp in pixels:
        grid[r, c] = temp
    sky_map.update(gx, gy, grid)
    ax.set_aspect("equal")             # cla() inside update() wiped these
    ax.set_xlabel("RA offset (deg)"); ax.set_ylabel("Dec offset (deg)")
    ax.set_title("On-the-fly sky survey, serpentine scan")
    fig.tight_layout()


# ---------------------------------------------------------------------------
# Data acquisition -- replace this with your own survey controller. Every-
# thing above only needs a list of (row, col, temperature) pixels handed to
# on_new_pixels() as they're measured.
# ---------------------------------------------------------------------------
rng = np.random.default_rng(19)
cols, rows = np.meshgrid(np.arange(NX), np.arange(NY))
ra = (cols + 0.5) * 3.0 / NX - 1.5
dec = (rows + 0.5) * 2.0 / NY - 1.0

# Background sky temperature plus two point sources of different brightness.
SOURCES = [(-0.5, 0.3, 8.0, 0.06), (0.6, -0.2, 4.5, 0.05)]
temp_k = 2.7 + 0.05 * rng.standard_normal((NY, NX))
for src_ra, src_dec, peak, width in SOURCES:
    temp_k += peak * np.exp(-((ra - src_ra) ** 2 + (dec - src_dec) ** 2) / (2 * width ** 2))

# Serpentine order: row 0 left to right, row 1 right to left, and so on --
# an on-the-fly survey never slews back to the start of a row.
order = []
for r in range(NY):
    cols_this_row = range(NX) if r % 2 == 0 else range(NX - 1, -1, -1)
    order.extend((r, c) for c in cols_this_row)
PIXELS_PER_TICK = 10


def read_next_pixels(lo, hi):
    """Stand-in for the dish reporting whichever pixels it measured this
    tick, in serpentine order.
    """
    return [(r, c, float(temp_k[r, c])) for r, c in order[lo:hi]]


for lo in range(0, len(order), PIXELS_PER_TICK):
    hi = min(lo + PIXELS_PER_TICK, len(order))
    on_new_pixels(read_next_pixels(lo, hi))
Total running time of the script: (0 minutes 10.677 seconds)