Note
Go to the end to download the full example code.
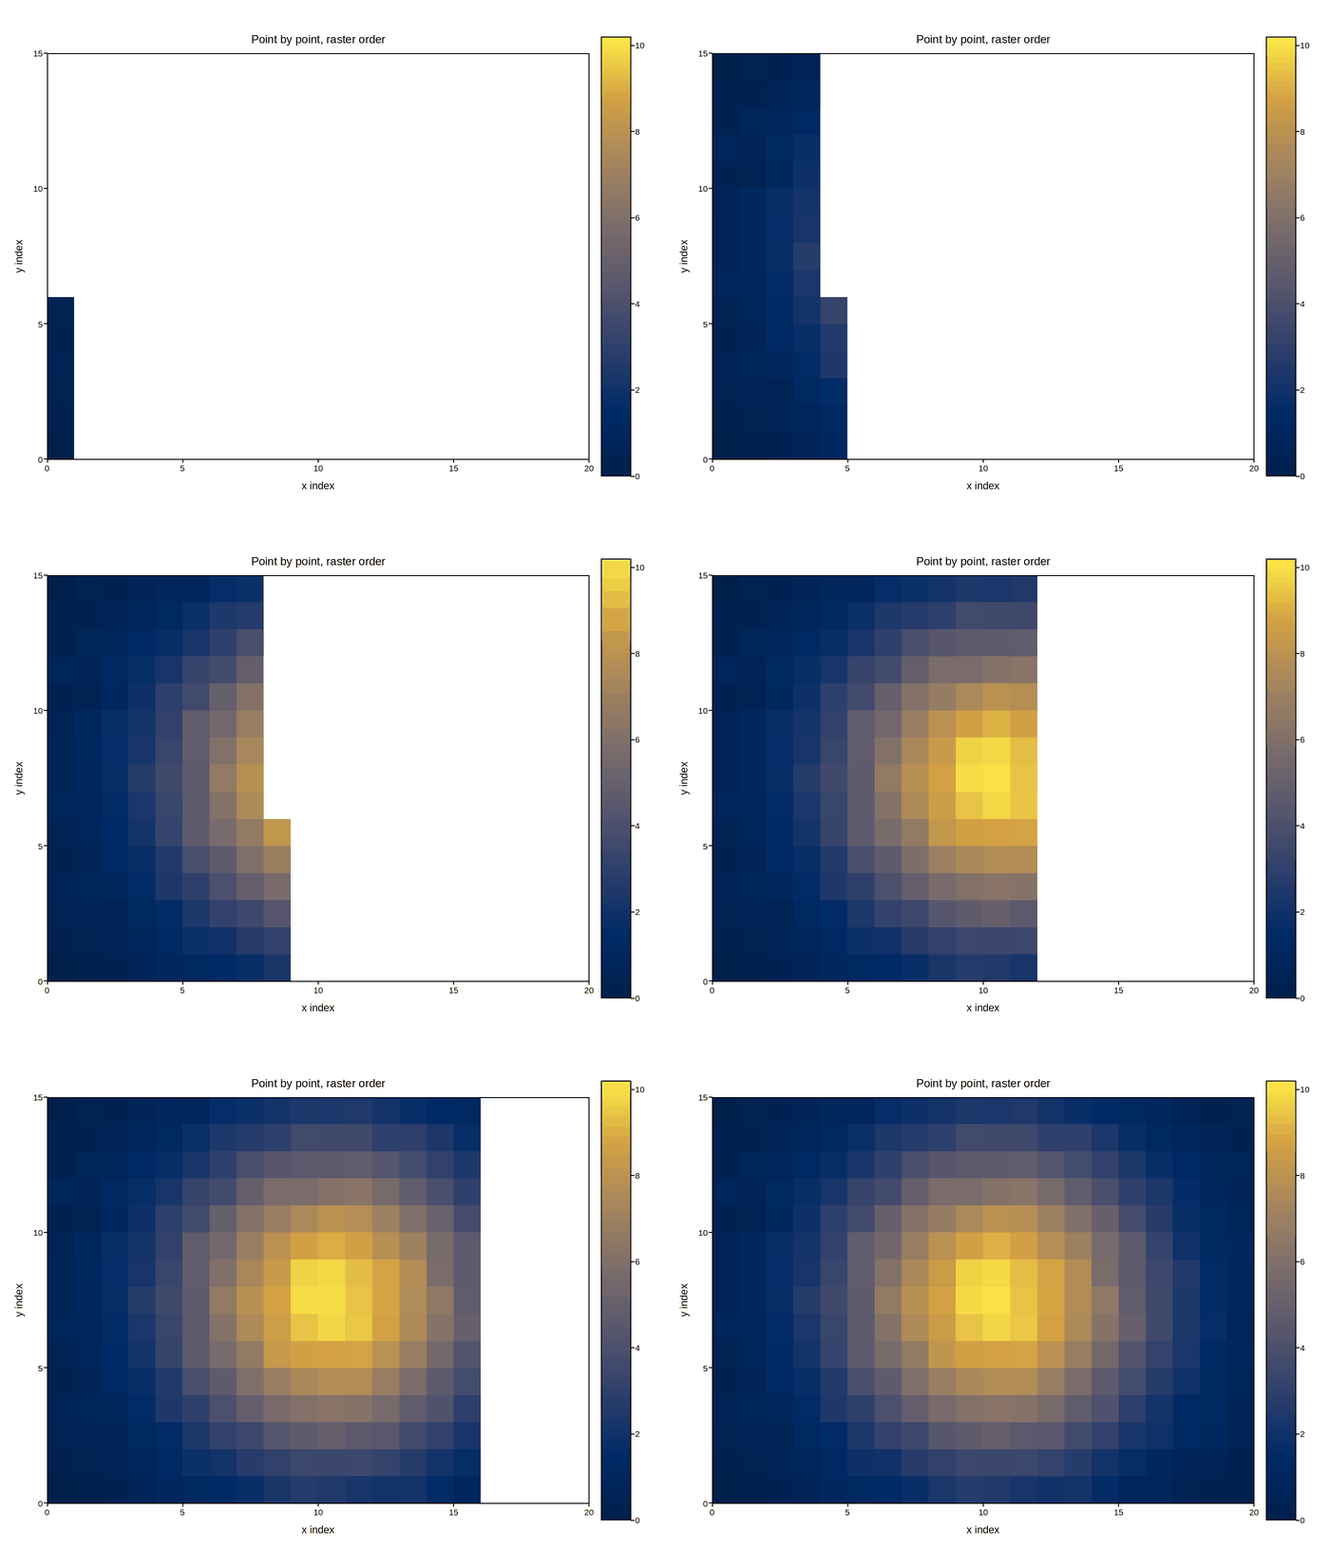
Point by point, raster order
The slowest and most literal case: one measurement at a time, stepping y
from bottom to top, then taking a single x step and repeating – the
order an actual raster-scanning instrument (a probe stage, a laser scanner)
physically sweeps in. The grid and colour scale are both known and fixed
throughout, exactly like Sparse, randomly-ordered acquisition; only the order cells
fill in differs between the two.
The code below is exactly what you’d write against the real
plotpress.qt.LiveArtist: a callback that receives whatever new points
the stage reported since the last tick and pushes the updated grid to the
plot, fed by a loop simulating a raster scan stage. Only
read_next_points() is meant to be replaced, with your own instrument
call.
import numpy as np
import plotpress


NY, NX = 15, 20
gx = np.arange(NX + 1, dtype=float)
gy = np.arange(NY + 1, dtype=float)
VMIN, VMAX = 0.0, 10.2   # the instrument's own known reading range

fig, ax = plotpress.subplots(figsize=(7, 5.5))
grid = np.full((NY, NX), np.nan)

# One-time setup: draw the still-empty grid so the axes decorations and
# colorbar are in place before any live updates start.
m0 = ax.pcolormesh(gx, gy, grid, cmap="cividis", vmin=VMIN, vmax=VMAX)
ax.set_aspect("equal")
ax.set_xlabel("x index"); ax.set_ylabel("y index")
ax.set_title("Point by point, raster order")
fig.colorbar(m0, ax=ax)
fig.tight_layout()

mesh = LiveArtist(ax, cmap="cividis", vmin=VMIN, vmax=VMAX)


def on_new_points(points):
    """Called once per acquisition tick with whatever ``(row, col, value)``
    points the stage reported since the last one.
    """
    for r, c, v in points:
        grid[r, c] = v
    mesh.update(gx, gy, grid)
    ax.set_aspect("equal")             # cla() inside update() wiped these
    ax.set_xlabel("x index"); ax.set_ylabel("y index")
    ax.set_title("Point by point, raster order")
    fig.tight_layout()


# ---------------------------------------------------------------------------
# Data acquisition -- replace this with your own raster stage controller.
# Everything above only needs a list of (row, col, value) points handed to
# on_new_points() as they're measured.
# ---------------------------------------------------------------------------
rng = np.random.default_rng(5)
cols, rows = np.meshgrid(np.arange(NX), np.arange(NY))
field = np.clip(
    np.exp(-((rows - 7) ** 2 + (cols - 10) ** 2) / 35.0) * 10.0
    + 0.15 * rng.standard_normal((NY, NX)), 0.0, None)

# Column by column, bottom to top within each column -- a real scan stage's
# order, not a shuffled one.
order = [(r, c) for c in range(NX) for r in range(NY)]
POINTS_PER_TICK = 6


def read_next_points(lo, hi):
    """Stand-in for the stage reporting whichever points it measured this
    tick, in raster order.
    """
    return [(r, c, float(field[r, c])) for r, c in order[lo:hi]]


for lo in range(0, len(order), POINTS_PER_TICK):
    hi = min(lo + POINTS_PER_TICK, len(order))
    on_new_points(read_next_points(lo, hi))
Total running time of the script: (0 minutes 4.544 seconds)