Note
Go to the end to download the full example code.
GridSpec margins
add_gridspec accepts the same left/right/top/bottom/
wspace/hspace margin kwargs as subplots_adjust(),
applied immediately as the figure’s own margins – a shorthand for setting
spacing at grid-creation time instead of a separate subplots_adjust call.
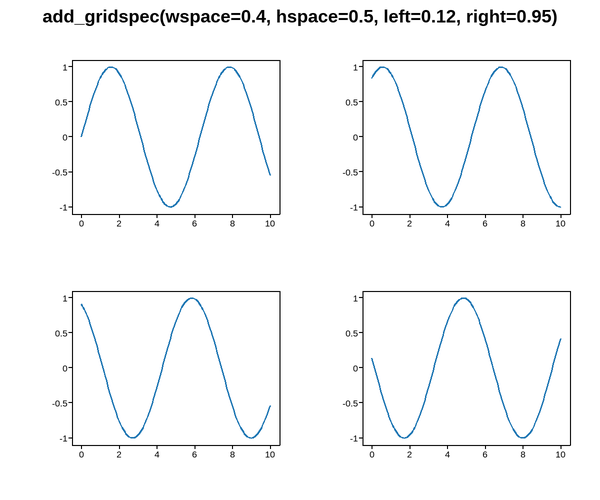
Live figure — pick a tool, then zoom, pan, point-pick or annotate. Nothing is active until a tool is selected.
View this figure’s Vega export ↗ — the raw JSON spec, rendered live by a real Vega engine.
View this figure’s Vega-Lite export ↗ — the raw JSON spec(s), rendered live by a real Vega-Lite engine.
import numpy as np
import plotpress

x = np.linspace(0, 10, 200)

fig = plotpress.Figure(figsize=(6, 5))
gs = fig.add_gridspec(2, 2, wspace=0.4, hspace=0.5, left=0.12, right=0.95)
for i in range(4):
    ax = fig.add_subplot(gs[i // 2, i % 2])
    ax.plot(x, np.sin(x + i))
fig.suptitle("add_gridspec(wspace=0.4, hspace=0.5, left=0.12, right=0.95)")
Total running time of the script: (0 minutes 0.079 seconds)