Note
Go to the end to download the full example code.
Drilling into one panel with ax.print_summary()
print_summary() is the per-axes half of
print_layout_summary() – useful once
print_layout_summary() has told you which panel needs a closer
look, or any time you already have one Axes in hand (inside a loop
over fig.axes, say) and want its own position, scale, and export
compatibility without re-printing the whole figure.
Three real relationships in one figure – a plain grid cell, an
inset_axes() zoom, and a colorbar – each
describes itself differently.
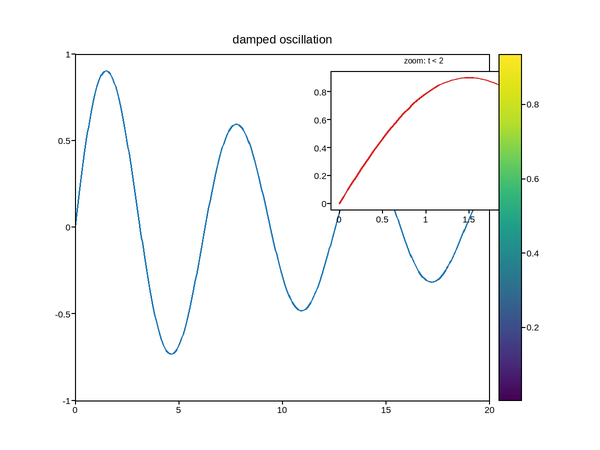
Live figure — pick a tool, then zoom, pan, point-pick or annotate. Nothing is active until a tool is selected.
View this figure’s Vega export ↗ — the raw JSON spec, rendered live by a real Vega engine.
View this figure’s Vega-Lite export ↗ — the raw JSON spec(s), rendered live by a real Vega-Lite engine.
Axes 0:
  position:  row 0, col 0 of a 1x1 grid
  visible:   True
  x:  linear, [0, 20]
  y:  linear, [-1, 1]
  artists:   1 Line2D, 1 QuadMesh
  title:     'damped oscillation'
  to_vega():      OK
  to_vega_lite(): OK

Axes 1:
  position:  inset of axes 0
  visible:   True
  x:  linear, [-0.09774, 2.053]
  y:  linear, [-0.04513, 0.9477]
  artists:   1 Line2D
  title:     'zoom: t < 2'
  to_vega():      OK
  to_vega_lite(): 1 gap(s)
    - [vega-lite] axes 1 is an inset_axes() -- Vega-Lite's hconcat/vconcat composition has no way to position it relative to the other axes, so it was exported as its own independent spec.

Axes 2:
  position:  colorbar for axes 0
  visible:   True
  x:  linear, [-0.05, 1.05]
  y:  linear, [-0.05, 1.05]
  artists:   none
  to_vega():      OK
  to_vega_lite(): 1 gap(s)
    - [vega-lite] axes 2 is a colorbar -- Vega-Lite's hconcat/vconcat composition has no way to position it relative to the axes it belongs to, so it was exported as its own independent gradient-image panel instead.
import numpy as np
import plotpress

fig, ax = plotpress.subplots(figsize=(6, 4.5))
t = np.linspace(0, 20, 400)
ax.plot(t, np.sin(t) * np.exp(-t / 15))
ax.set_title("damped oscillation")

zoom = ax.inset_axes((0.55, 0.55, 0.4, 0.4))
zoom.plot(t[:40], np.sin(t[:40]) * np.exp(-t[:40] / 15), color="C3")
zoom.set_title("zoom: t < 2", fontsize=8)

mesh = ax.pcolormesh(np.linspace(0, 20, 6), np.linspace(-1, 1, 6),
                     np.random.default_rng(0).random((5, 5)), alpha=0)
cbar = fig.colorbar(mesh, ax=ax)

for panel in fig.axes:
    panel.print_summary()
    print()
Total running time of the script: (0 minutes 0.090 seconds)