Note
Go to the end to download the full example code.
Mixed subplot grid shapes
fig.add_subplot(nrows, ncols, index) positions purely from that call’s own
(nrows, ncols) – nothing stops one figure from mixing shapes across
calls, the classic “one wide panel over two narrow ones” layout: a
(2, 1, 1) axes spans the top half, then two (2, 2, 3)/(2, 2, 4)
axes split the bottom half into quarters. Every axes still tiles cleanly
because both shapes divide the same margins the same way, but nothing here
shares one consistent grid the way a single add_gridspec grid does –
export formats that compose per-panel views into one grid (e.g.
to_vega_lite()) fall back to exporting each
axes as its own independent view instead of one combined layout.
tight_layout() assumes one shared grid shape
too, so this figure skips it and relies on each axes’ own initial rect
(every add_subplot call divides the same figure margins, so the panels
still tile without gaps or overlap).
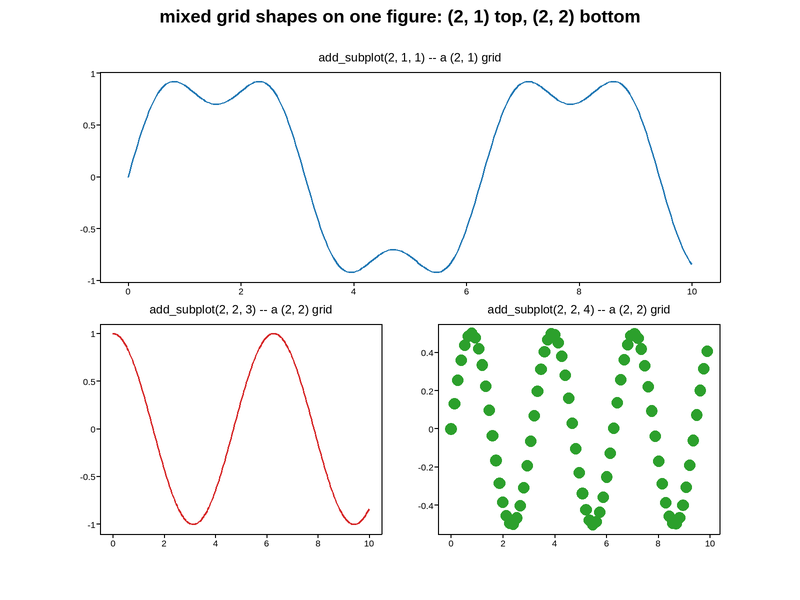
Live figure — pick a tool, then zoom, pan, point-pick or annotate. Nothing is active until a tool is selected.
View this figure’s Vega export ↗ — the raw JSON spec, rendered live by a real Vega engine.
View this figure’s Vega-Lite export ↗ — the raw JSON spec(s), rendered live by a real Vega-Lite engine.
import numpy as np
import plotpress

t = np.linspace(0, 10, 300)

fig = plotpress.Figure(figsize=(8, 6))
top = fig.add_subplot(2, 1, 1)
bottom_left = fig.add_subplot(2, 2, 3)
bottom_right = fig.add_subplot(2, 2, 4)

top.plot(t, np.sin(t) + 0.3 * np.sin(3 * t), color="#1f77b4")
top.set_title("add_subplot(2, 1, 1) -- a (2, 1) grid")

bottom_left.plot(t, np.cos(t), color="#d62728")
bottom_left.set_title("add_subplot(2, 2, 3) -- a (2, 2) grid")

bottom_right.scatter(t[::4], np.sin(t[::4]) * np.cos(t[::4]), s=8, color="#2ca02c")
bottom_right.set_title("add_subplot(2, 2, 4) -- a (2, 2) grid")

fig.suptitle("mixed grid shapes on one figure: (2, 1) top, (2, 2) bottom")
Total running time of the script: (0 minutes 0.131 seconds)