Note
Go to the end to download the full example code.
Figure title and shared axis labels
fig.suptitle() sets one title spanning the whole figure, above every
subplot – distinct from ax.set_title(), which titles a single axes.
fig.supxlabel()/fig.supylabel() do the same for a shared x/y axis
label, useful when every panel in a grid shares the same units and
repeating the label on each one would be redundant.
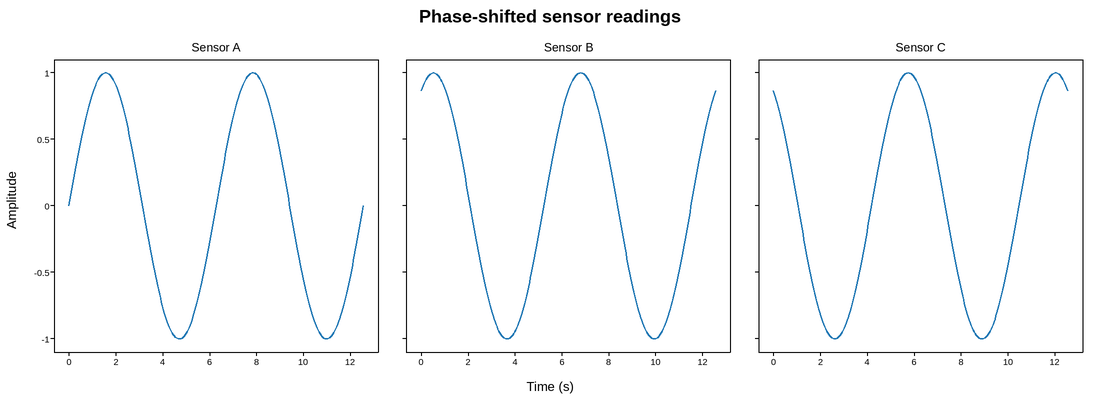
Live figure — pick a tool, then zoom, pan, point-pick or annotate. Nothing is active until a tool is selected.
View this figure’s Vega export ↗ — the raw JSON spec, rendered live by a real Vega engine.
View this figure’s Vega-Lite export ↗ — the raw JSON spec(s), rendered live by a real Vega-Lite engine.
import numpy as np
import plotpress

t = np.linspace(0, 4 * np.pi, 300)
fig, axes = plotpress.subplots(1, 3, figsize=(11, 4), sharey=True)

for ax, phase, label in zip(axes, [0.0, np.pi / 3, 2 * np.pi / 3],
                            ["Sensor A", "Sensor B", "Sensor C"]):
    ax.plot(t, np.sin(t + phase))
    ax.set_title(label)

fig.suptitle("Phase-shifted sensor readings")
fig.supxlabel("Time (s)")
fig.supylabel("Amplitude")
fig.tight_layout()
Total running time of the script: (0 minutes 0.124 seconds)