Note
Go to the end to download the full example code.
Sizing by the subplot, not the figure
figsize says how big the whole figure is, which means the size each panel
actually ends up is whatever is left after the tick labels, titles, colorbars,
group boxes and supxlabel have taken their share. On one or two panels that
is easy to eyeball. On a grid it is not, and it gets worse as the grid grows:
what a reader needs is a panel big enough to read, and none of the furniture
around the grid scales the way the panels do.
subplot_size=(w, h) turns it around. Give the size of one subplot in inches
and figsize is solved for it, with whatever room the decorations need added
on top rather than taken out of the panels.
import numpy as np
import plotpress

g = np.linspace(-3, 3, 24)
X, Y = np.meshgrid(g, g)
FIELD = np.exp(-((X - 0.6) ** 2 + (Y + 0.4) ** 2) / 3) + 0.3 * np.sin(1.5 * X)


def build(nrows, ncols, **size):
    fig, axes = plotpress.subplots(nrows, ncols, squeeze=False, **size)
    first = axes[0][0]
    for i, ax in enumerate(ax for row in axes for ax in row):
        ax.pcolormesh(g, g, FIELD + 0.05 * i, cmap="viridis")
        ax.set_title(f"panel {i}", fontsize=7)
        ax.set_xlabel("x", fontsize=7)
        ax.set_ylabel("y", fontsize=7)
        ax.tick_params(labelsize=6)
    fig.suptitle(f"{nrows}x{ncols}")
    fig.supxlabel("shared x")
    fig.supylabel("shared y")
    fig.tight_layout()
    return fig, first


def panel_inches(fig, ax):
    """What one subplot actually measures, in inches.

    ``get_position()`` is in figure fractions, so multiplying by ``figsize``
    turns it back into the physical size the panel will print at.
    """
    _, _, frac_w, frac_h = ax.get_position()
    return frac_w * fig.figsize[0], frac_h * fig.figsize[1]
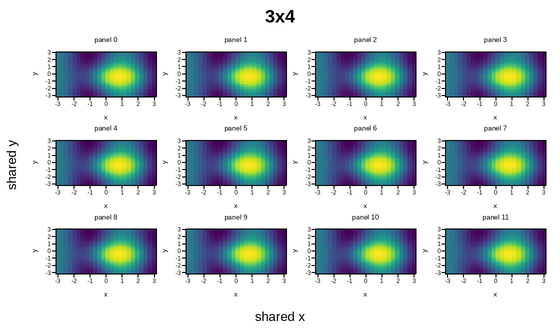
The usual guess. A 3x4 grid of 1.4 x 1.1in panels “should” be 5.6 x 4.4in – so ask for that and see what the panels come out as:
This figure has 12 panels — too many to usefully embed at a fixed size.
Open the full interactive example in a new page to pick a tool, then zoom, pan, point-pick or annotate any panel.
View this figure’s Vega export ↗ — the raw JSON spec, rendered live by a real Vega engine.
View this figure’s Vega-Lite export ↗ — the raw JSON spec(s), rendered live by a real Vega-Lite engine.
figsize=(5.6, 3.3) -> panels are 1.00 x 0.45in, not the 1.40 x 1.10 that multiplication implied
Every panel came out well under the intended size, because the multiplication
never accounted for the room the labels need. Correcting it by hand means
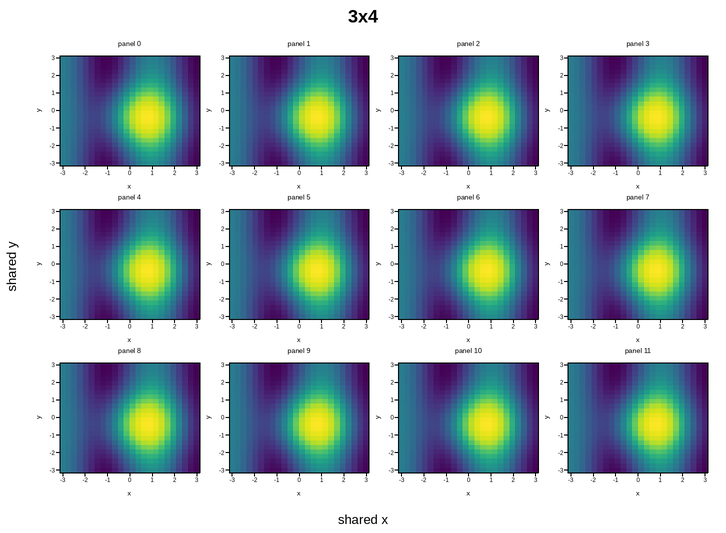
guessing again. subplot_size states the requirement instead:
sized, first = build(3, 4, subplot_size=(1.4, 1.1))
sw, sh = panel_inches(sized, first)
print(f"subplot_size=(1.4, 1.1) -> panels are {sw:.2f} x {sh:.2f}in "
      f"in a {sized.figsize[0]:.2f} x {sized.figsize[1]:.2f}in figure")
This figure has 12 panels — too many to usefully embed at a fixed size.
Open the full interactive example in a new page to pick a tool, then zoom, pan, point-pick or annotate any panel.
View this figure’s Vega export ↗ — the raw JSON spec, rendered live by a real Vega engine.
View this figure’s Vega-Lite export ↗ — the raw JSON spec(s), rendered live by a real Vega-Lite engine.
subplot_size=(1.4, 1.1) -> panels are 1.40 x 1.10in in a 7.26 x 5.33in figure
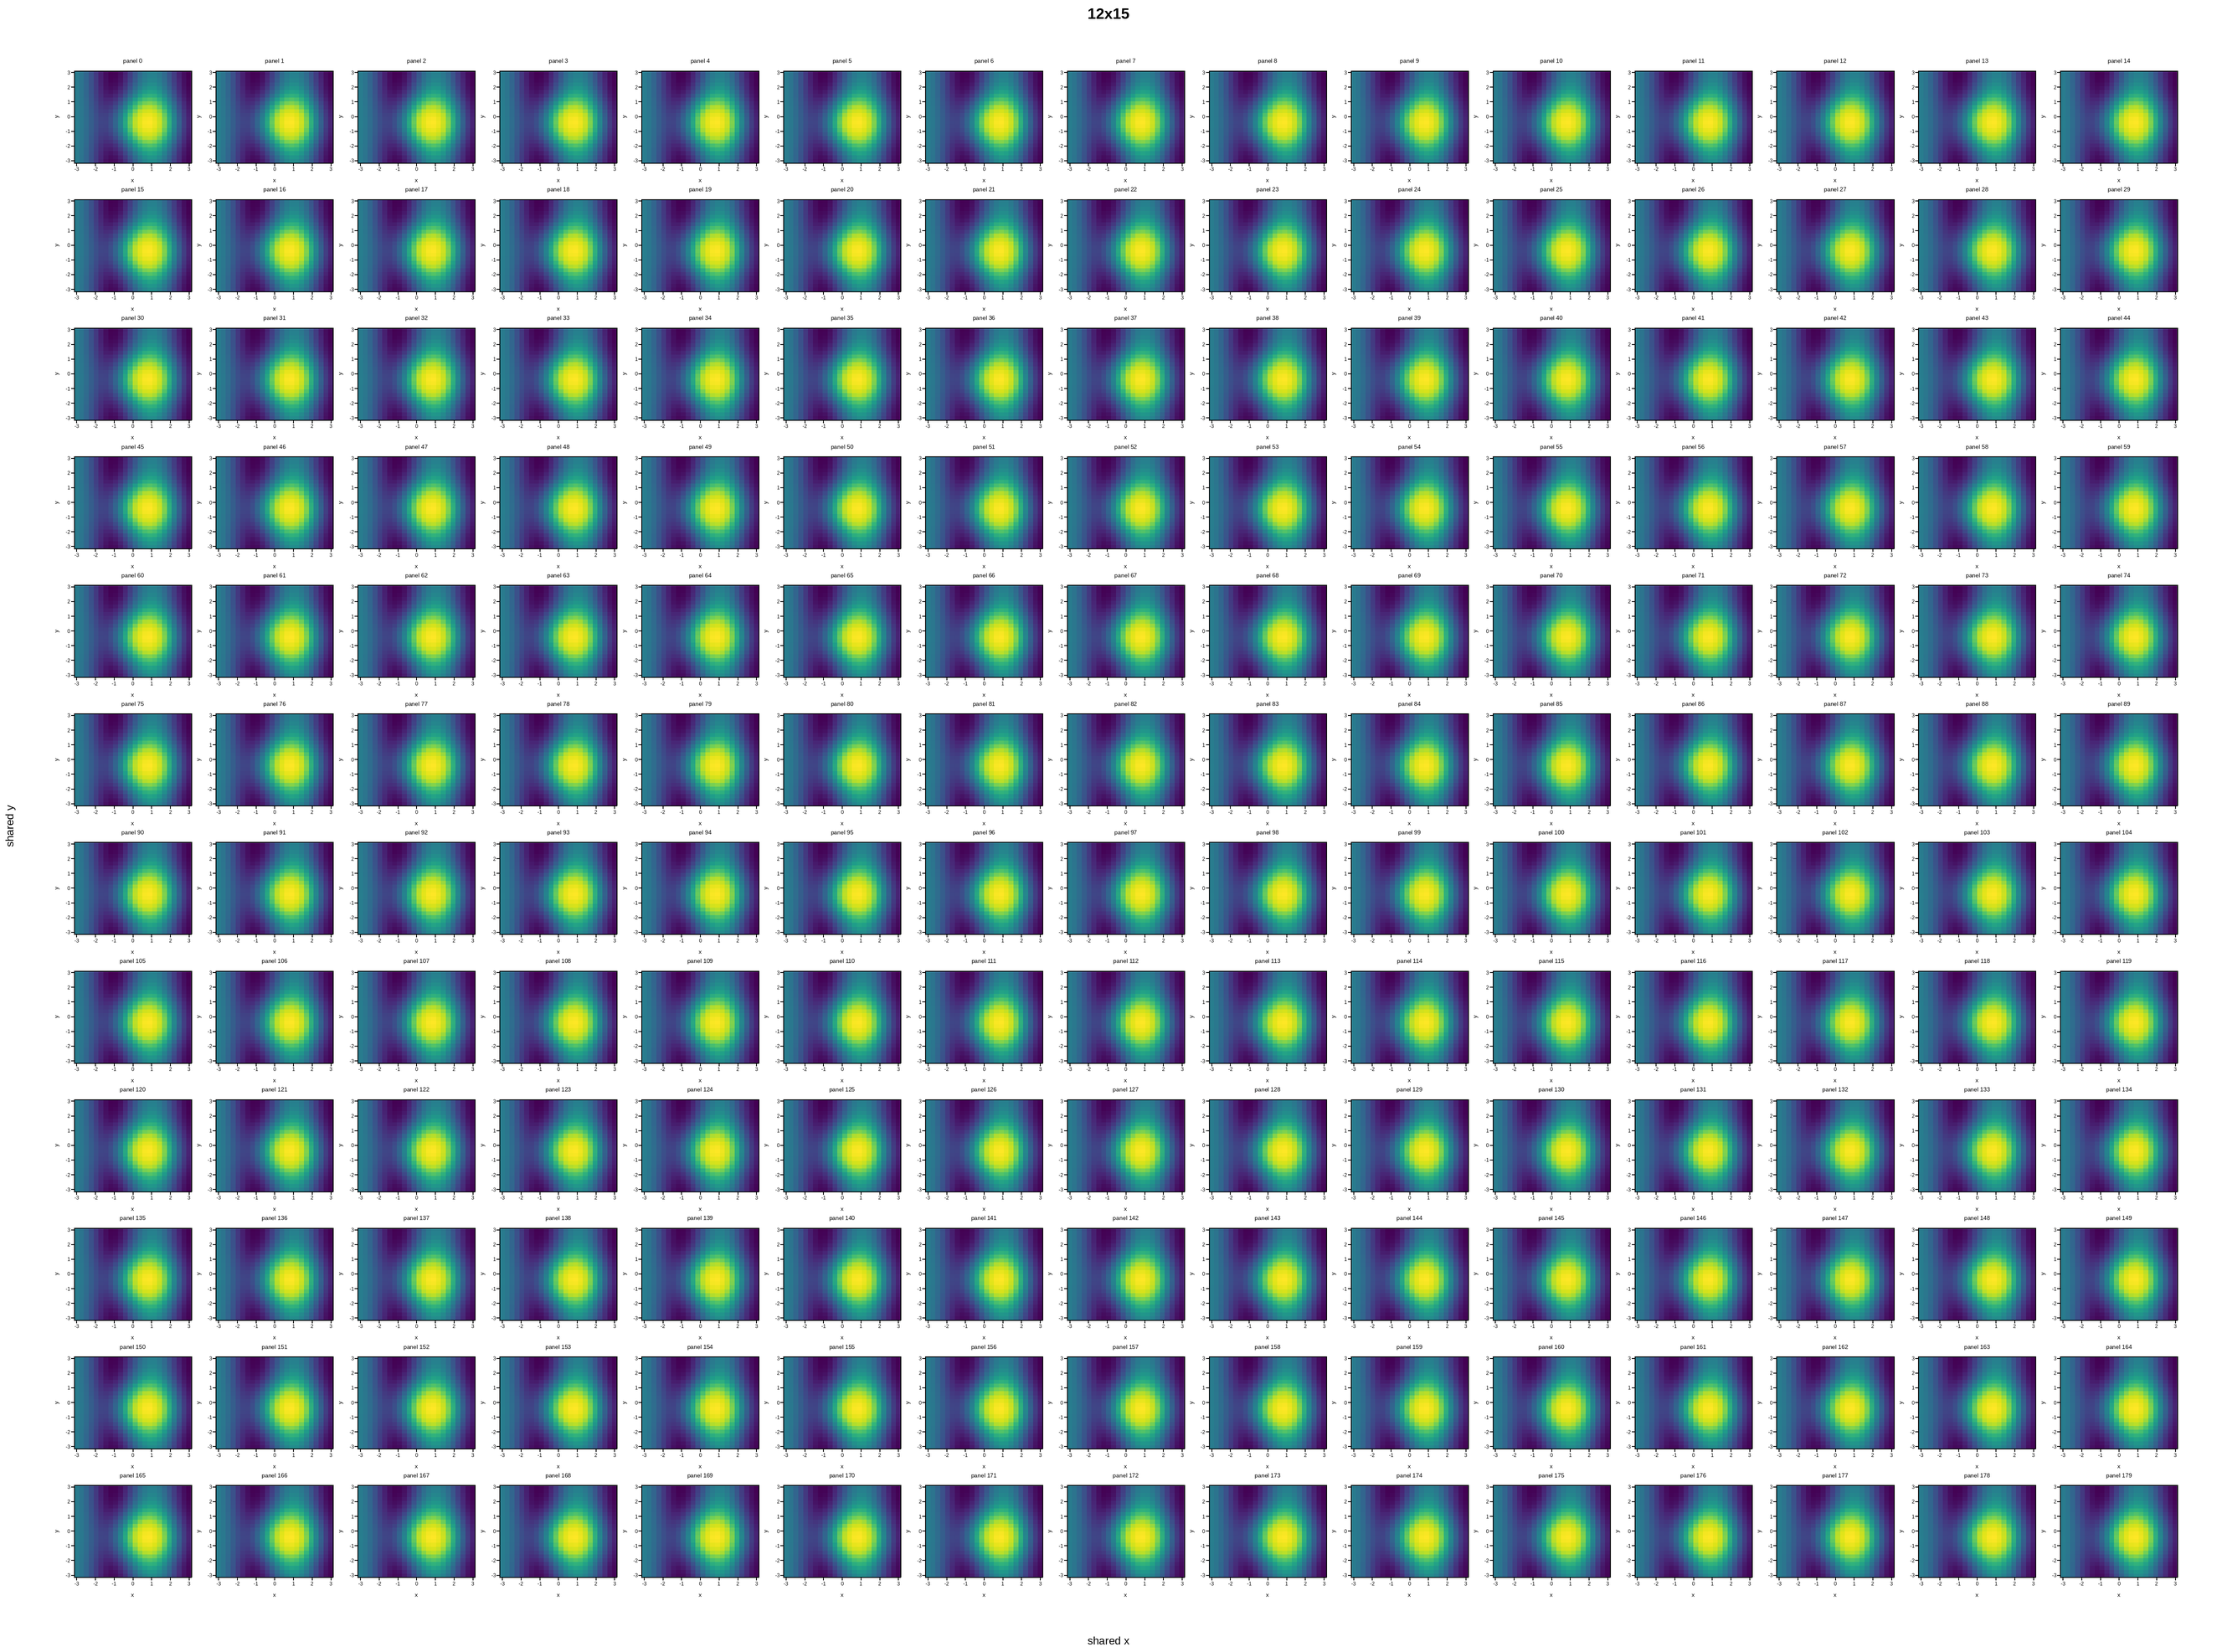
The gap widens with the grid, which is the real reason to reach for this. The
same 1.4 x 1.1in panel is asked for at three grid sizes; figsize grows to
suit, and the panels stay exactly the size requested:
This figure has 180 panels — too many to usefully embed at a fixed size.
Open the full interactive example in a new page to pick a tool, then zoom, pan, point-pick or annotate any panel.
View this figure’s Vega export ↗ — the raw JSON spec, rendered live by a real Vega engine.
View this figure’s Vega-Lite export ↗ — the raw JSON spec(s), rendered live by a real Vega-Lite engine.
 2x2  -> figsize   3.8 x   3.7in, panels 1.40 x 1.10in
 5x6  -> figsize  10.8 x   8.5in, panels 1.40 x 1.10in
12x15 -> figsize  26.5 x  19.7in, panels 1.40 x 1.10in
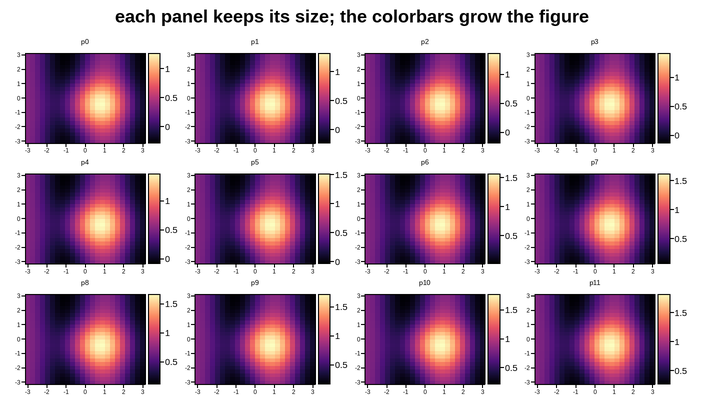
Nothing about the decorations is special-cased: a suptitle band, per-axes colorbars and group boxes are all just more furniture to measure and add. Here the same 1.2 x 0.9in panel is requested with a colorbar beside each one, and the panels are still 1.2 x 0.9in – the figure simply got wider.
fig, axes = plotpress.subplots(3, 4, subplot_size=(1.2, 0.9), squeeze=False)
for i, ax in enumerate(ax for row in axes for ax in row):
    mesh = ax.pcolormesh(g, g, FIELD + 0.05 * i, cmap="magma")
    ax.set_title(f"p{i}", fontsize=7)
    ax.tick_params(labelsize=6)
    fig.colorbar(mesh, ax=ax, fraction=0.08)
fig.suptitle("each panel keeps its size; the colorbars grow the figure")
fig.tight_layout()
pw, ph = panel_inches(fig, axes[0][0])
print(f"with a colorbar each -> panels {pw:.2f} x {ph:.2f}in "
      f"in a {fig.figsize[0]:.2f} x {fig.figsize[1]:.2f}in figure")
This figure has 12 panels — too many to usefully embed at a fixed size.
Open the full interactive example in a new page to pick a tool, then zoom, pan, point-pick or annotate any panel.
View this figure’s Vega export ↗ — the raw JSON spec, rendered live by a real Vega engine.
View this figure’s Vega-Lite export ↗ — the raw JSON spec(s), rendered live by a real Vega-Lite engine.
with a colorbar each -> panels 1.20 x 0.90in in a 7.04 x 4.10in figure
tight_layout() is what does the solving, so it has to run – it already
does at render time if you never call it yourself. That also means the answer
is measured against the labels actually set, rather than a guess made
before they existed: set a longer title afterwards and the re-fit keeps the
panels the size you asked for.
See 500 panels, 250 groups, each with its own colorbar for the same knob on 500 panels in 250 groups, where hand-computing a figsize is least practical.
Total running time of the script: (0 minutes 3.967 seconds)