Note
Go to the end to download the full example code.
Orienting yourself in an unfamiliar figure
print_layout_summary() is the fastest way to
understand a figure you didn’t build yourself – one loaded from a saved
layout, handed to you by a teammate, or reconstructed from someone else’s
HTML export. Rather than reading fig.axes/ax.artists by hand, ask
the figure directly: how many panels, how they’re arranged, what’s on
each one, and whether it would export cleanly to to_vega()/
to_vega_lite().
This figure deliberately mixes several real structural cases in one place
– a plain grid, a twinx() overlay, a legend, and one artist kind
neither Vega exporter maps yet – so the summary below has something real
to say about each.
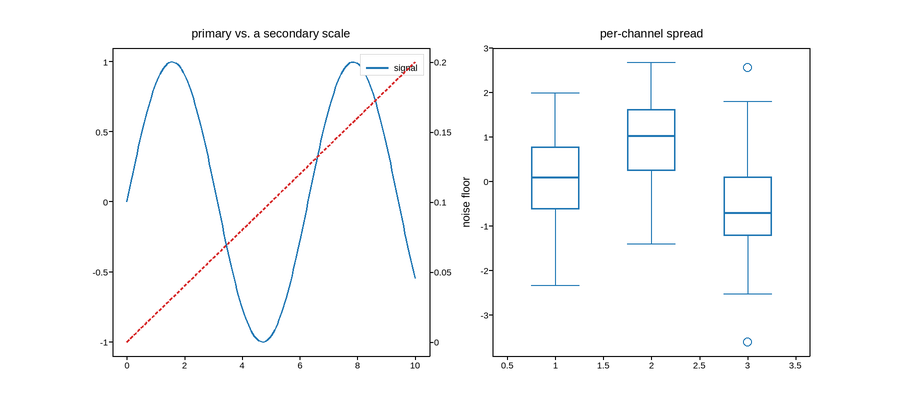
Live figure — pick a tool, then zoom, pan, point-pick or annotate. Nothing is active until a tool is selected.
View this figure’s Vega export ↗ — the raw JSON spec, rendered live by a real Vega engine.
View this figure’s Vega-Lite export ↗ — the raw JSON spec(s), rendered live by a real Vega-Lite engine.
Figure: 3 axes (3 visible), figsize=(9, 4)

Axes 0:
  position:  row 0, col 0 of a 1x2 grid
  visible:   True
  x:  linear, [-0.5, 10.5]
  y:  linear, [-1.1, 1.1]
  artists:   1 Line2D
  title:     'primary vs. a secondary scale'
  to_vega():      1 gap(s)
  to_vega_lite(): 1 gap(s)
    - [vega] figure_to_vega(): axes 0 has a legend, which to_vega() does not export yet -- skipped.
    - [vega-lite] figure_to_vega_lite(): axes 0 has a legend, which to_vega_lite() does not export yet -- skipped.

Axes 1:
  position:  row 0, col 1 of a 1x2 grid
  visible:   True
  x:  linear, [0.35, 3.65]
  y:  linear, [-3.921, 3.004]
  artists:   1 BoxPlot
  title:     'per-channel spread'
  to_vega():      1 gap(s)
  to_vega_lite(): 1 gap(s)
    - [vega] figure_to_vega(): axes 1 has a BoxPlot artist with no Vega mapping yet (box plots, violins, quiver, contour, event plots, wind barbs, tables, and plot_frames()/pcolormesh_frames() sliders aren't supported) -- skipped, the rest of the figure still exports.
    - [vega-lite] figure_to_vega_lite(): axes 1 has a BoxPlot artist with no Vega-Lite mapping yet (box plots, violins, quiver, contour, event plots, wind barbs, tables, arbitrary polygon batches (e.g. hexbin), and plot_frames()/pcolormesh_frames() sliders) -- skipped, the rest of the figure still exports.

Axes 2:
  position:  twinx() overlay of axes 0
  visible:   True
  x:  linear, [-0.5, 10.5]
  y:  linear, [-0.01, 0.21]
  artists:   1 Line2D
  labels:    xlabel='' ylabel='noise floor'
  to_vega():      OK
  to_vega_lite(): OK
import numpy as np
import plotpress

fig, axes = plotpress.subplots(1, 2, figsize=(9, 4))

t = np.linspace(0, 10, 200)
axes[0].plot(t, np.sin(t), label="signal")
axes[0].legend()
axes[0].set_title("primary vs. a secondary scale")
noise_floor = axes[0].twinx()
noise_floor.plot(t, 0.02 * t, color="C3", linestyle="--")
noise_floor.set_ylabel("noise floor")

rng = np.random.default_rng(0)
axes[1].boxplot([rng.normal(m, 1, 80) for m in (0, 1, -0.5)])
axes[1].set_title("per-channel spread")

fig.print_layout_summary()
Total running time of the script: (0 minutes 0.096 seconds)