Note
Go to the end to download the full example code.
Combining figures into a Report
Report bundles several already-built figures into one self-contained HTML
file, each with its own title/details annotation and its own independent
toolbar, pan/zoom, and point-picking – because every figure renders inside
its own <iframe> rather than being spliced directly into the page (see
plotpress.Report’s docstring for why: an interactive figure’s JS assumes
it owns the page). Handy for a write-up covering several figures at once –
one file to open, one file to send.
Every entry is collapsible: a click on its “Figure N”/title header hides
just that figure, leaving the title and details visible, so a report with
many figures still reads as a scannable outline rather than a wall of
plots – and a Collapse All/Expand All button does the same for all
of them at once. collapsed=True starts every entry collapsed instead of
open and genuinely defers it: a collapsed figure’s document isn’t parsed
or rendered at all until a reader actually expands that entry, so the file
opens instantly regardless of how many figures it holds.
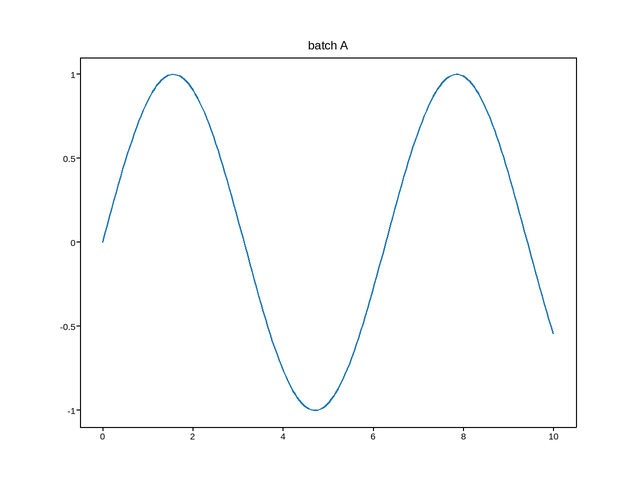
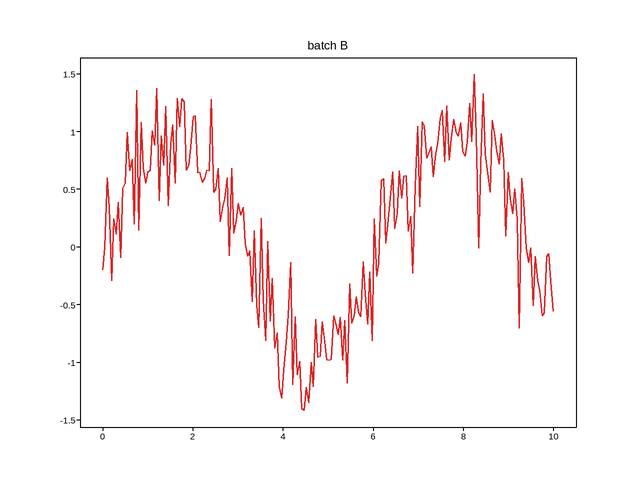
Live figure — pick a tool, then zoom, pan, point-pick or annotate. Nothing is active until a tool is selected.
View this figure’s Vega export ↗ — the raw JSON spec, rendered live by a real Vega engine.
View this figure’s Vega-Lite export ↗ — the raw JSON spec(s), rendered live by a real Vega-Lite engine.
Live figure — pick a tool, then zoom, pan, point-pick or annotate. Nothing is active until a tool is selected.
View this figure’s Vega export ↗ — the raw JSON spec, rendered live by a real Vega engine.
View this figure’s Vega-Lite export ↗ — the raw JSON spec(s), rendered live by a real Vega-Lite engine.
import os
import tempfile

import numpy as np
import plotpress

x = np.linspace(0, 10, 200)
rng = np.random.default_rng(4)

fig_a, ax_a = plotpress.subplots()
ax_a.plot(x, np.sin(x), color="#1f77b4")
ax_a.set_title("batch A")

fig_b, ax_b = plotpress.subplots()
ax_b.plot(x, np.sin(x) + 0.3 * rng.standard_normal(x.size), color="#d62728")
ax_b.set_title("batch B")

report = plotpress.Report(title="Weekly QA sweep",
                          description="Two sensor batches, one figure each.")
report.add(fig_a, title="Batch A", details="Baseline run, no anomalies.")
report.add(fig_b, title="Batch B", details="Elevated noise floor after 14:00.")
path = os.path.join(tempfile.gettempdir(), "plotpress_gallery_report.html")
report.save(path)

# The same report, but every entry starts collapsed -- worth it once a
# report holds enough figures that scrolling past all of them, fully
# rendered, gets slow.
collapsed_path = os.path.join(tempfile.gettempdir(),
                              "plotpress_gallery_report_collapsed.html")
report.save(collapsed_path, collapsed=True)
Total running time of the script: (0 minutes 0.125 seconds)