Note
Go to the end to download the full example code.
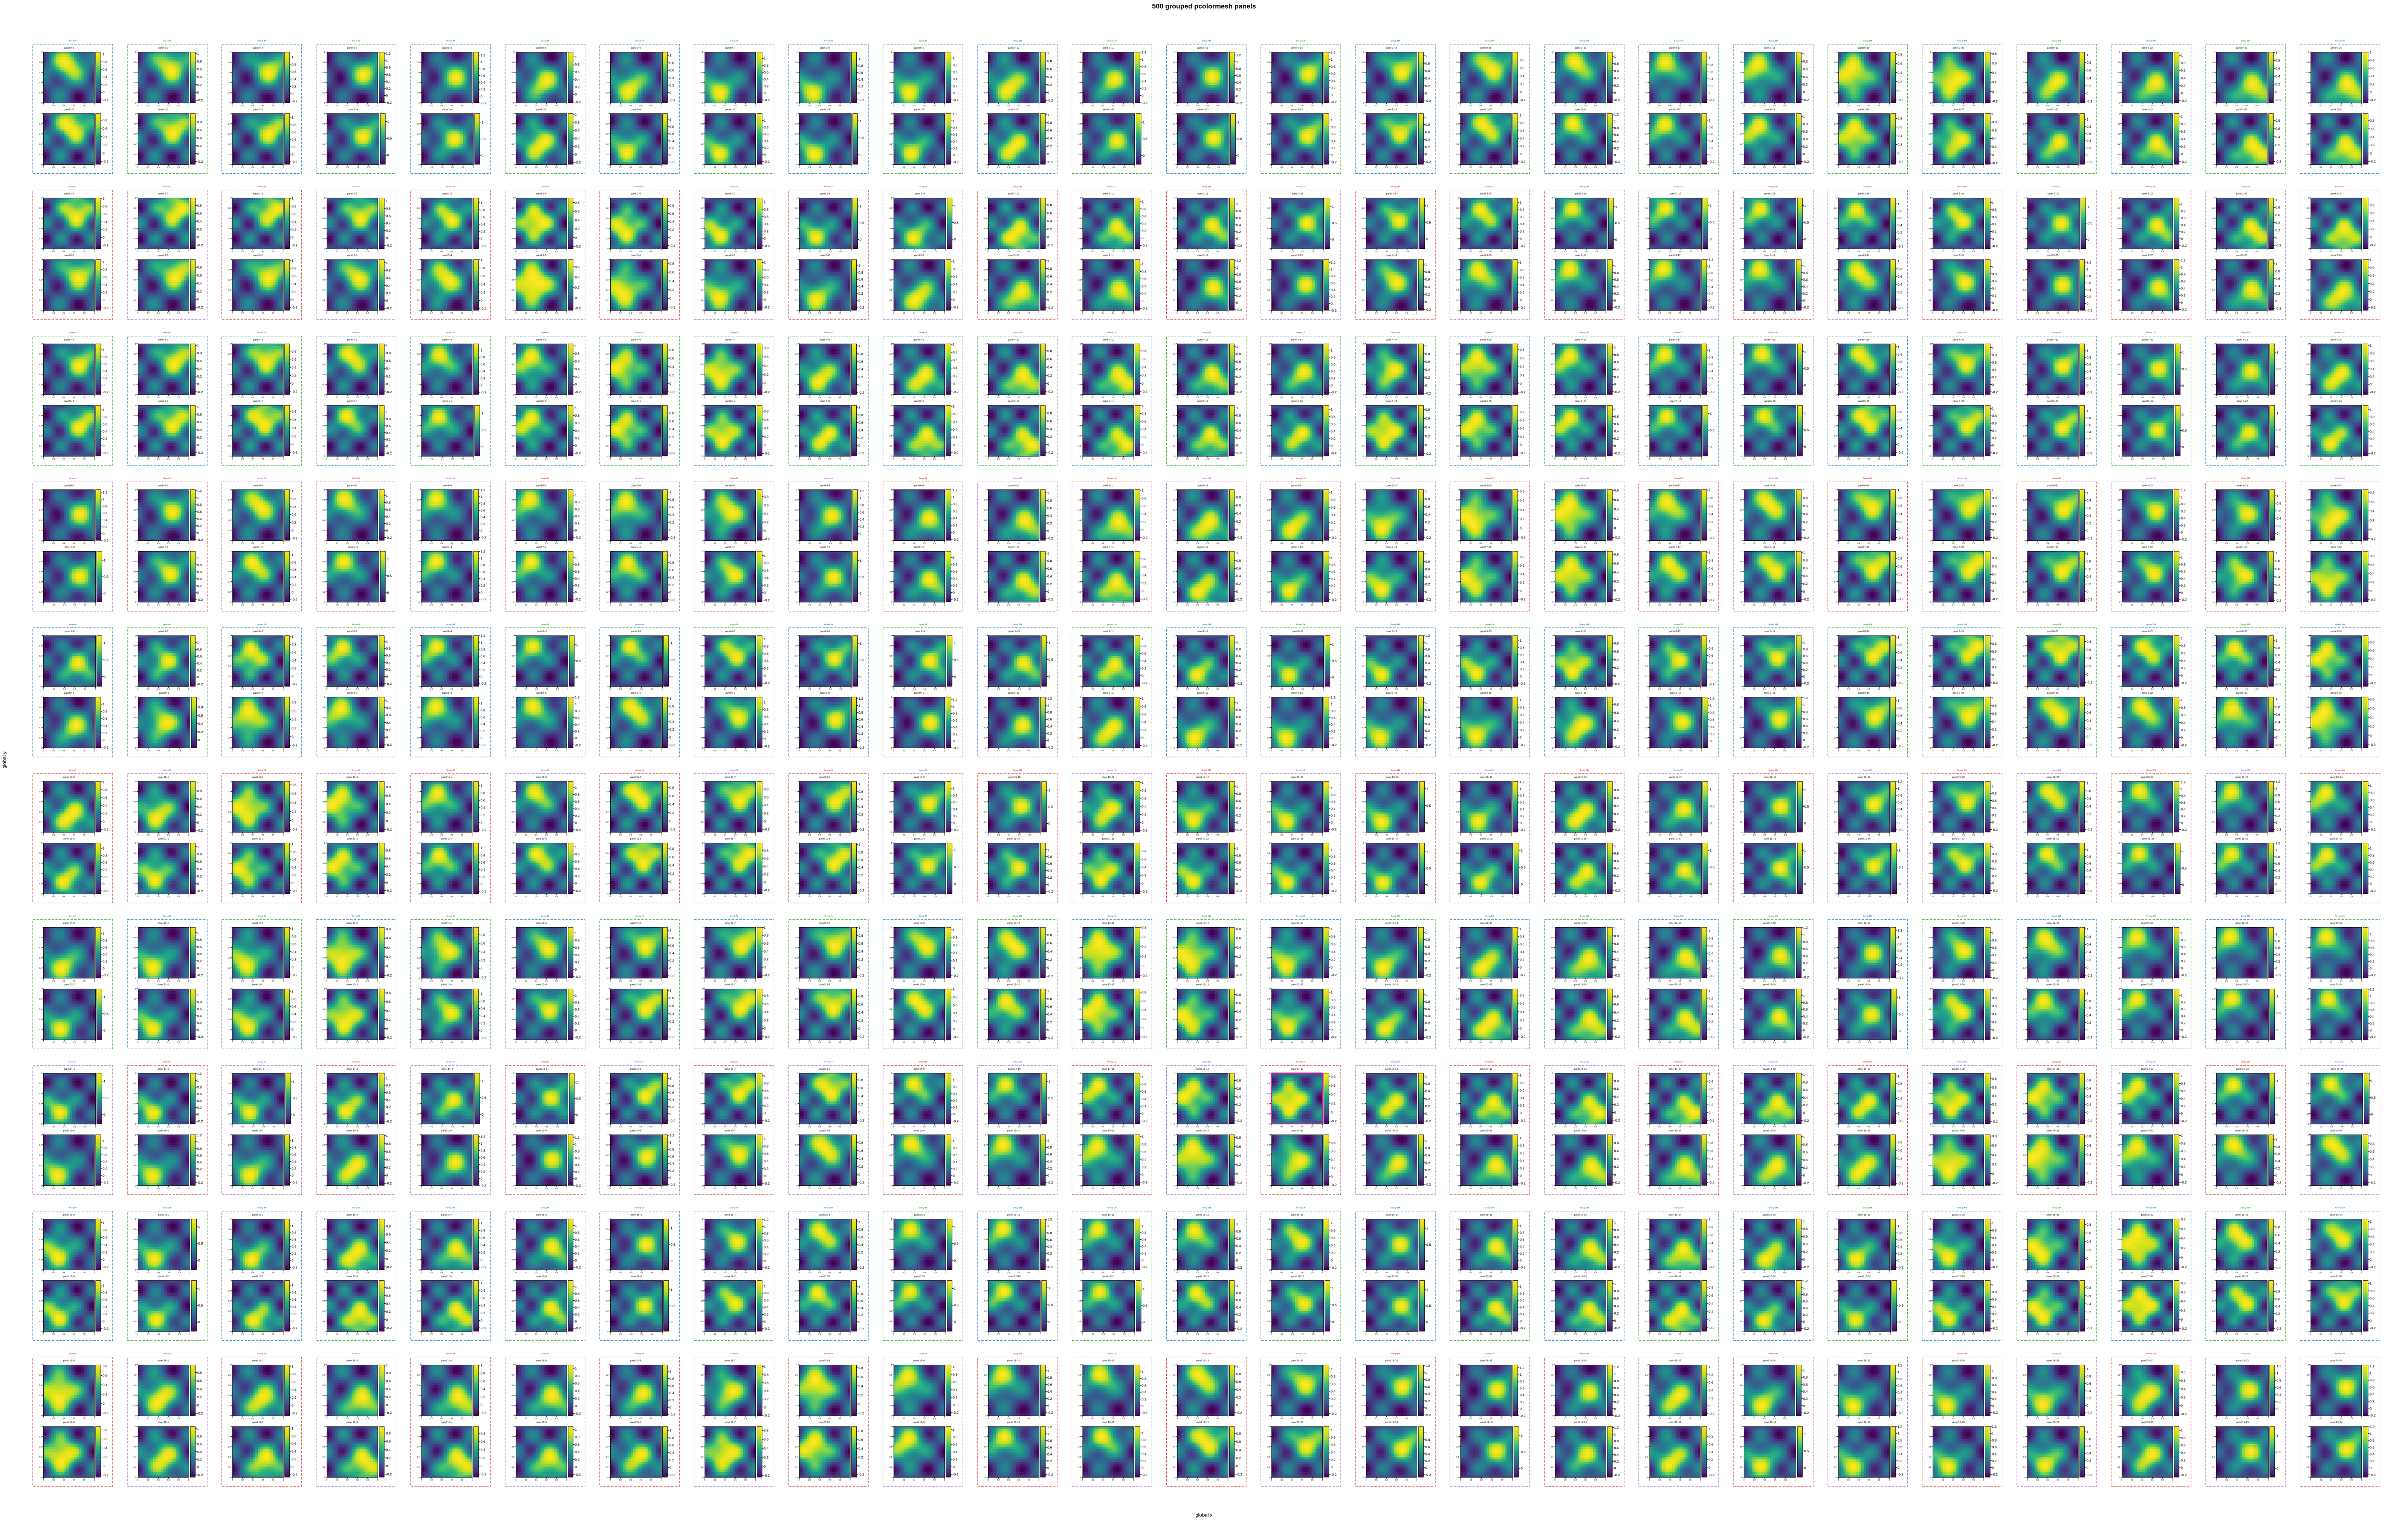
500 panels, 250 groups, each with its own colorbar
The flagship case for everything the grouping gallery covers at once: 25
columns of 10 stacked row-pairs (500 pcolormesh panels total), each
pair its own group, each panel its own colorbar, and each group’s box
cycling through four accent colors so a reader can tell neighboring groups
apart at a glance without reading every title.
Built with GroupLayout: a 10x25 outer
arrangement of groups, each one a plain 2x1 (two rows, one column) inner
shape – the row-pair itself. That’s the whole layout description; nothing
here computes which of the 500 flat-grid cells a given pair actually
occupies the way indexing into one big axes[r][col] array used to.
This is also what motivated group()’s
max()-not-+= outer-margin fix: 25 of these 250 groups (one per
column) share the grid’s own top edge, all title-facing. They still need
only one correctly-sized top margin between them – not one that grows
with how many columns happen to reach that edge.
Every panel keeps its own tick numbers rather than hiding the inner ones
the way a sharex/sharey grid would – a figure-level
supxlabel()/
supylabel() still names the shared axis
once, but each panel’s own 0/0.5/1 stays readable at a glance rather than
only appearing at the true grid edges. Building all 500 panels, their
colorbars, and every group box still takes well under a second – see the
scale gallery for what happens well past this size.
500 panels each carrying a title, tick numbers, and its own colorbar need
real room per panel to stay legible, not just per-group separation – an
SVG never loses resolution zooming in, but the figure should still read
cleanly at a normal glance, not just under a magnifier. figsize scales
generously per panel (not the tighter ratio a plainer grid could get away
with) and group_spacing reserves visible, uncrowded gaps between
groups rather than the bare minimum tight_layout() would allow.
Finally, get_group() finds one specific
group by its title alone, and its own get_ax()
reaches one particular panel inside it by inner position – not by
remembering which of this figure’s 1000 total axes (500 panels + 500
colorbars) it is, or which (row, col) of the shared super-grid
GroupLayout resolved that pair to. The
magenta-bordered panel below was never touched during the build loop
above; it is found and styled afterward, from nothing but the string
"Group 137". See Finding a group or axes again: title, id, or position for
this lookup API gathered in one dedicated example.
This figure has 500 panels — too many to usefully embed at a fixed size.
Open the full interactive example in a new page to pick a tool, then zoom, pan, point-pick or annotate any panel.
View this figure’s Vega export ↗ — the raw JSON spec, rendered live by a real Vega engine.
View this figure’s Vega-Lite export ↗ — the raw JSON spec(s), rendered live by a real Vega-Lite engine.
Group 137's top panel is 'panel 14–13' -- confirming the magenta-bordered one above is the one actually found by title.
import numpy as np
import plotpress

GROUP_COLORS = ["#1f77b4", "#d62728", "#2ca02c", "#9467bd"]  # blue/red/green/purple

NROWS, NCOLS = 20, 25     # 500 panels, 250 top/bottom groups
N_PAIRS = NROWS // 2      # 10 row-pairs per column -> the outer grid's own rows
MESH_N = 20               # 20x20 mesh per panel

layout = plotpress.GroupLayout(N_PAIRS, NCOLS)
for col in range(NCOLS):
    for row_pair in range(N_PAIRS):
        group_idx = col * N_PAIRS + row_pair
        color = GROUP_COLORS[group_idx % len(GROUP_COLORS)]
        layout.add_group(row_pair, col, 2, 1, title=f"Group {group_idx}",
                        color=color, linewidth=1.0, fontsize=5)

# subplot_size= rather than a hand-multiplied figsize: at this size what is
# actually known is how big one panel has to be to stay readable, and
# figsize=(NCOLS * 1.6, NROWS * 1.6) does not deliver 1.6in panels -- the
# ticks, titles, 500 colorbars, 250 group boxes and the sup-labels all come
# out of that total. Stating the panel size gets the panels; the room for
# everything else is measured and added.
fig, axes = plotpress.subplots_from_groups(layout, subplot_size=(1.35, 1.35))

x_edges = np.linspace(0, 1, MESH_N + 1)
# A smooth Gaussian-plus-ripple field per panel (the same shape as the
# gridded_data gallery's own gouraud-shading example), each with a shifted
# center and frequency so every panel looks distinct without being pure
# noise -- real structure to read a colorbar value off of.
g = np.linspace(-3, 3, MESH_N)
Xc, Yc = np.meshgrid(g, g)

for col in range(NCOLS):
    for row_pair in range(N_PAIRS):
        top_row, bot_row = row_pair * 2, row_pair * 2 + 1
        for within_pair, r in enumerate((top_row, bot_row)):
            ax = axes[row_pair, col][within_pair]
            cx = 1.6 * np.sin(0.6 * col + 0.3 * r)
            cy = 1.6 * np.cos(0.5 * row_pair - 0.4 * col)
            freq = 1.3 + 0.15 * (r % 3)
            z = (np.exp(-((Xc - cx) ** 2 + (Yc - cy) ** 2) / 4)
                 + 0.3 * np.sin(freq * Xc) * np.cos(freq * Yc))
            mesh = ax.pcolormesh(x_edges, x_edges, z, cmap="viridis")
            ax.set_title(f"panel {r}–{col}", fontsize=6)
            ax.tick_params(labelsize=5)
            fig.colorbar(mesh, ax=ax, fraction=0.08)

fig.group_spacing(wspace=60, hspace=44)
fig.suptitle("500 grouped pcolormesh panels")
fig.supxlabel("global x")
fig.supylabel("global y")
fig.tight_layout()

# Address one axes within a group by its group's title, not its global
# position: fig.get_group() finds any group by the title given when it
# was created, and its own get_ax(row=, col=) addresses one of its axes by
# *inner* position -- (0, 0) is simply "this pair's top panel," the same
# indexing already used to plot into it above, without knowing which of
# the figure's 1000 axes it actually is.
top_panel = fig.get_group(title="Group 137").get_ax(row=0, col=0)
for side in top_panel.spines:
    top_panel.spines[side].set_color("#e91e8c")
    top_panel.spines[side].set_linewidth(2.5)
print(f"Group 137's top panel is {top_panel.get_title()!r} -- confirming the "
     "magenta-bordered one above is the one actually found by title.")
Total running time of the script: (0 minutes 12.163 seconds)