Note
Go to the end to download the full example code.
Irregular group shapes (deleted axes)
GroupLayout.add_group() takes an optional mask – an nrows x
ncols array-like of truthy/falsy values marking which inner cells
actually get an axes. A falsy cell is simply never created: no blank
Axes sitting there unused, and each group’s box (from
group()) still bounds only its own real
cells, so it hugs whatever shape the mask actually describes – a ring, an
L, a diagonal, a plus sign – instead of the full rectangle a plain
nrows x ncols group would draw.
All four groups below sit in one GroupLayout(1, 4) – a single outer
row – each with its own independent 3x3 mask. The combined grid
subplots_from_groups() builds underneath is
exactly as ordinary as any other: every real axes below is one flat
SubplotSpec span, same as subplots() itself
would produce.
The Diagonal group’s own three real cells are given ids directly in its
mask via axes_ids – a non-None entry both marks presence and
names that axes in one step, mosaic-style – demonstrated below alongside
every other way to find a group or an axes again afterward: by the
group’s title or id, by an axes’ inner (row, col) position within its
group, by an axes’ own id, and (since titles may legitimately repeat,
unlike ids) collecting every axes that shares one via many=True. See
Finding a group or axes again: title, id, or position for this whole lookup API
gathered on its own, without the mask shapes as a distraction.
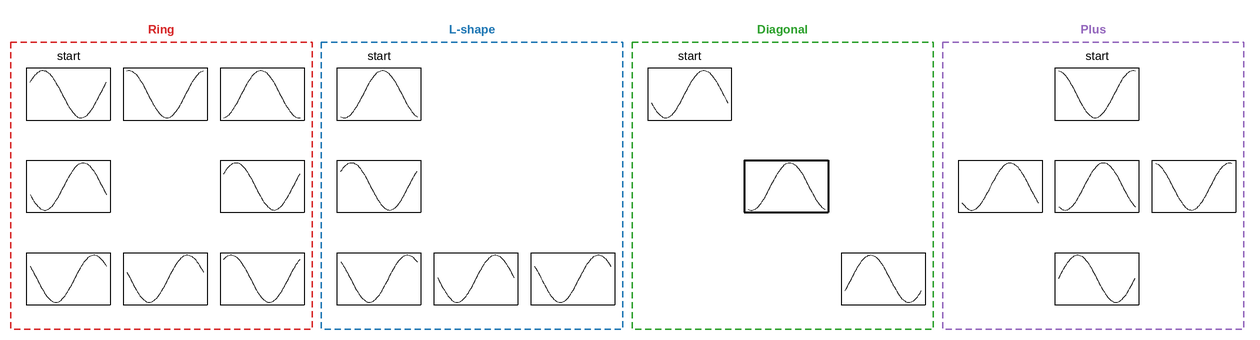
This figure has 21 panels — too many to usefully embed at a fixed size.
Open the full interactive example in a new page to pick a tool, then zoom, pan, point-pick or annotate any panel.
View this figure’s Vega export ↗ — the raw JSON spec, rendered live by a real Vega engine.
View this figure’s Vega-Lite export ↗ — the raw JSON spec(s), rendered live by a real Vega-Lite engine.
as expected, a duplicate id raises: 'diag-1' is already used by another axes in this figure
4 axes titled 'start', one per group
import numpy as np
import plotpress

RING = [[1, 1, 1],
       [1, 0, 1],
       [1, 1, 1]]
L_SHAPE = [[1, 0, 0],
          [1, 0, 0],
          [1, 1, 1]]
DIAGONAL_IDS = [["diag-0", None, None],
                [None, "diag-1", None],
                [None, None, "diag-2"]]
PLUS = [[0, 1, 0],
       [1, 1, 1],
       [0, 1, 0]]

layout = plotpress.GroupLayout(1, 4)
layout.add_group(0, 0, mask=RING, title="Ring", color="#d62728")
layout.add_group(0, 1, mask=L_SHAPE, title="L-shape", color="#1f77b4")
layout.add_group(0, 2, axes_ids=DIAGONAL_IDS, title="Diagonal", id="diagonal",
                color="#2ca02c")
layout.add_group(0, 3, mask=PLUS, title="Plus", color="#9467bd")

fig, axes = plotpress.subplots_from_groups(layout, figsize=(12, 3.4))

rng = np.random.default_rng(3)
x = np.linspace(0, 2 * np.pi, 60)
for group in axes:
    for ax in group.ravel():
        if ax is None:
            continue   # this cell's mask entry was falsy -- nothing to plot
        ax.plot(x, np.sin(x + rng.uniform(0, 6)), color="#333333", linewidth=1.2)
        ax.set_xticks([])
        ax.set_yticks([])

fig.group_spacing(wspace=20.0)
fig.tight_layout()

# Finding the Diagonal group, and one specific axes within it, by inner
# position -- impossible before Group kept the mask's own shape, since a
# masked group's axes otherwise has no (row, col) left to address once
# some of its cells are missing.
diagonal = fig.get_group(title="Diagonal")   # or id="diagonal"
center = diagonal.get_ax(row=1, col=1)
for side in center.spines:
    center.spines[side].set_color("black")
    center.spines[side].set_linewidth(2.0)

# The same axes, found straight from the figure by the id its mask gave
# it at construction time -- no group lookup step at all.
assert fig.get_ax(id="diag-1") is center

# Ids are unique per figure by construction -- reusing one raises rather
# than silently attaching two axes to the same identity.
try:
    diagonal.get_ax(row=0, col=0).set_id("diag-1")
except ValueError as exc:
    print("as expected, a duplicate id raises:", exc)

# Titles, unlike ids, are allowed to repeat -- tag each shape's own first
# real cell (not every shape has the same one present: RING's own center
# is its hole, and PLUS has no corners) with a shared title and collect
# all four with many=True.
first_real_cell = {"Ring": (0, 0), "L-shape": (0, 0), "Diagonal": (0, 0), "Plus": (0, 1)}
for title, (r, c) in first_real_cell.items():
    fig.get_group(title=title).get_ax(row=r, col=c).set_title("start")

starts = fig.get_ax(title="start", many=True)
print(f"{len(starts)} axes titled 'start', one per group")
Total running time of the script: (0 minutes 0.171 seconds)