Note
Go to the end to download the full example code.
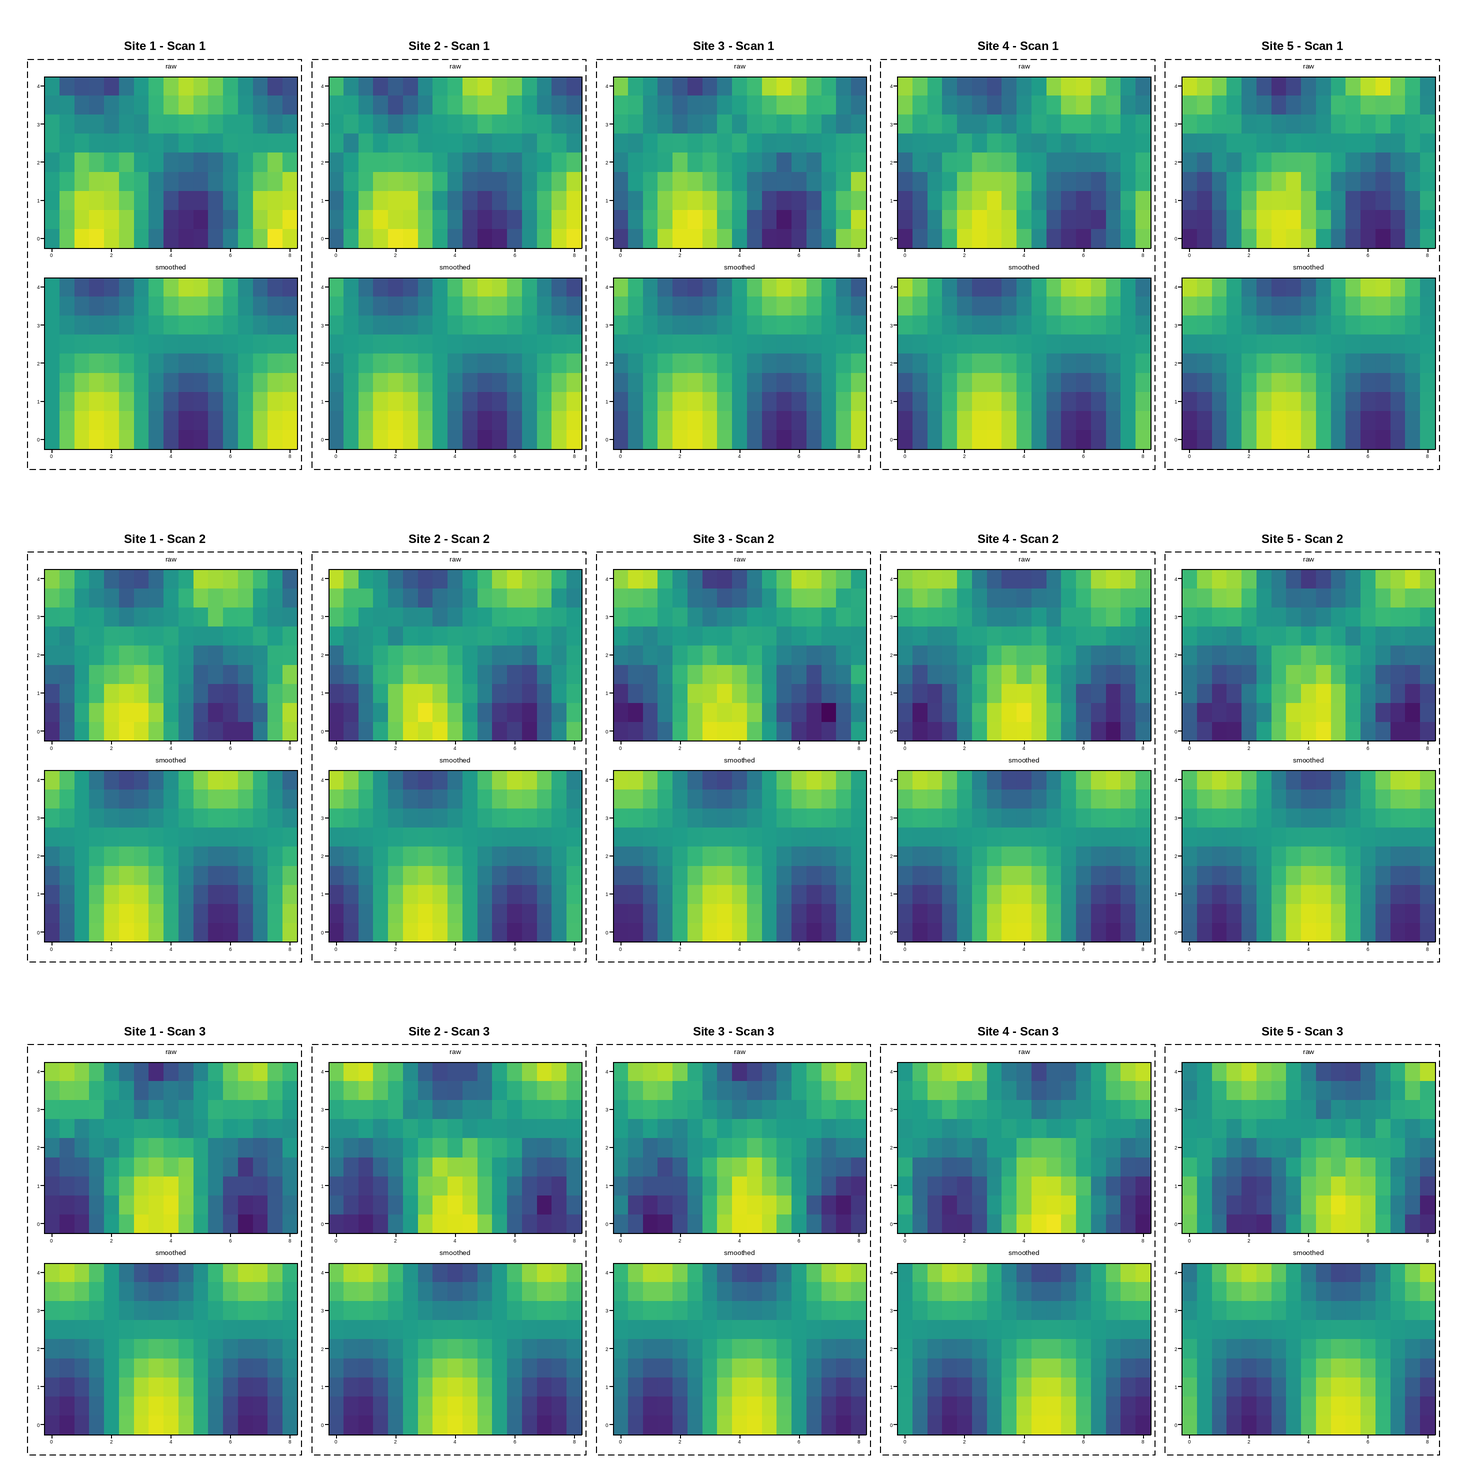
Many small groups: pairing every other row
A 6x5 grid of pcolormesh panels (30 total), split into fifteen small
two-panel groups – each pairing a row with the one directly below it in
the same column: rows 0/1, 2/3, and 4/5. Every group gets its own title, so
which panel goes with which reads at a glance instead of needing a caption.
Only the first row-pair of each column touches the grid’s own top edge,
so only those five groups get an automatic tight_layout() margin for
their titles (see the previous two examples); the other ten groups are
interior and would have their titles collide with the row above unless the
grid itself has enough vertical breathing room between rows to begin with.
Column-adjacent groups (one site next to another) are packed just as
tightly, so this needs both directions: group_spacing(wspace=...,
hspace=...) reserves that room explicitly, on top of whatever
tight_layout() already fit from tick/axis decorations alone – it knows
nothing about a group’s own title, which is exactly what this adds.
This figure has 30 panels — too many to usefully embed at a fixed size.
Open the full interactive example in a new page to pick a tool, then zoom, pan, point-pick or annotate any panel.
View this figure’s Vega export ↗ — the raw JSON spec, rendered live by a real Vega engine.
View this figure’s Vega-Lite export ↗ — the raw JSON spec(s), rendered live by a real Vega-Lite engine.
import numpy as np
import plotpress

rng = np.random.default_rng(4)
nrows, ncols = 6, 5
n_sites, n_scans = ncols, nrows // 2
x = np.linspace(0, 8, 17)
y = np.linspace(0, 4, 9)
X, Y = np.meshgrid(x, y)

fig, axes = plotpress.subplots(nrows, ncols, figsize=(14, 13))

for site in range(n_sites):
    phase = 0.4 * site
    for scan in range(n_scans):
        top_ax, bot_ax = axes[scan * 2, site], axes[scan * 2 + 1, site]
        base = np.sin(X - phase - scan) * np.cos(Y * 0.6)
        raw = base + 0.08 * rng.standard_normal(X.shape)
        top_ax.pcolormesh(x, y, raw, cmap="viridis", vmin=-1.2, vmax=1.2)
        bot_ax.pcolormesh(x, y, base, cmap="viridis", vmin=-1.2, vmax=1.2)
        top_ax.set_title("raw", fontsize=7)
        bot_ax.set_title("smoothed", fontsize=7)
        top_ax.tick_params(labelsize=5)
        bot_ax.tick_params(labelsize=5)
        fig.group(f"Site {site + 1} - Scan {scan + 1}", [top_ax, bot_ax],
                 title_position="top", pad=4.0, linewidth=1.0)

fig.group_spacing(wspace=18.0, hspace=65.0)
fig.tight_layout()
Total running time of the script: (0 minutes 0.922 seconds)