Note
Go to the end to download the full example code.
A group’s own shared x/y labels
fig.group() takes supxlabel/supylabel – the group-scoped
equivalent of supxlabel()/supylabel(),
for a cluster of panels that all share one x/y quantity so no individual
axes needs its own set_xlabel/set_ylabel repeated on every one of
them. Unlike title, which title_position can place on any of the
four sides, these always draw at one fixed edge – supxlabel centered
along the bottom, supylabel centered along the left, rotated – the
same fixed placement the figure-level versions use. The difference is
where: these draw inside the box, between its border and its member
axes, rather than outside the whole grid – the box grows to make room for
them (the same way it already grows for pad), rather than shrinking
any axes to fit.
Four panels below all plot the same two quantities – no panel needs its own “elapsed time (s)”/”amplitude” label repeated four times.
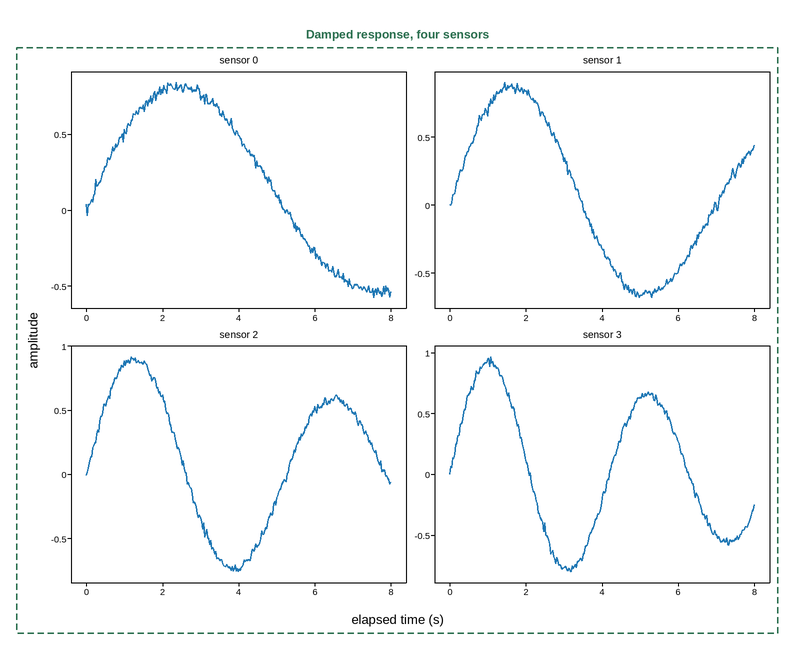
Live figure — pick a tool, then zoom, pan, point-pick or annotate. Nothing is active until a tool is selected.
View this figure’s Vega export ↗ — the raw JSON spec, rendered live by a real Vega engine.
View this figure’s Vega-Lite export ↗ — the raw JSON spec(s), rendered live by a real Vega-Lite engine.
import numpy as np
import plotpress

rng = np.random.default_rng(3)
t = np.linspace(0, 8, 300)

fig, axes = plotpress.subplots(2, 2, figsize=(8, 6.5))
for i, ax in enumerate(axes.ravel()):
    freq = 0.6 + 0.3 * i
    ax.plot(t, np.sin(freq * t) * np.exp(-0.08 * t)
            + 0.02 * rng.standard_normal(t.size))
    ax.set_title(f"sensor {i}", fontsize=10)

fig.group("Damped response, four sensors", list(axes.ravel()), color="#2b6f4f",
         supxlabel="elapsed time (s)", supylabel="amplitude")
fig.tight_layout()
Total running time of the script: (0 minutes 0.172 seconds)