Note
Go to the end to download the full example code.
Grouping a large grid of panels
fig.group() scales to a grid far bigger than the previous example’s –
here, two 5x3 column-bands (30 pcolormesh panels total) standing in for
two banks of a sensor array. A group’s bounding box only needs to touch the
grid’s own outer edge to get a reserved margin for its title; it does not
need to be a single row or column, or made up entirely of edge-row/edge-column
axes – a column-band spanning every row still reaches row 0, which is what
actually matters.
The boundary between the two banks (column 2 / column 3) is a different
story, though: it’s interior to the grid, and neither group’s “top” title
faces it, so nothing widens that gap automatically – each box still
needs room for its own tick labels beyond its bare axes, and left at
tight_layout()’s default column spacing, Bank B’s box (extending left
past its own y-tick labels) collided with Bank A’s box (extending right past
its own pad) right at that seam. group_spacing(wspace=...) widens every
column gap explicitly instead, interior boundary included – without giving
up tight_layout()’s own automatic margins the way subplots_adjust
would.
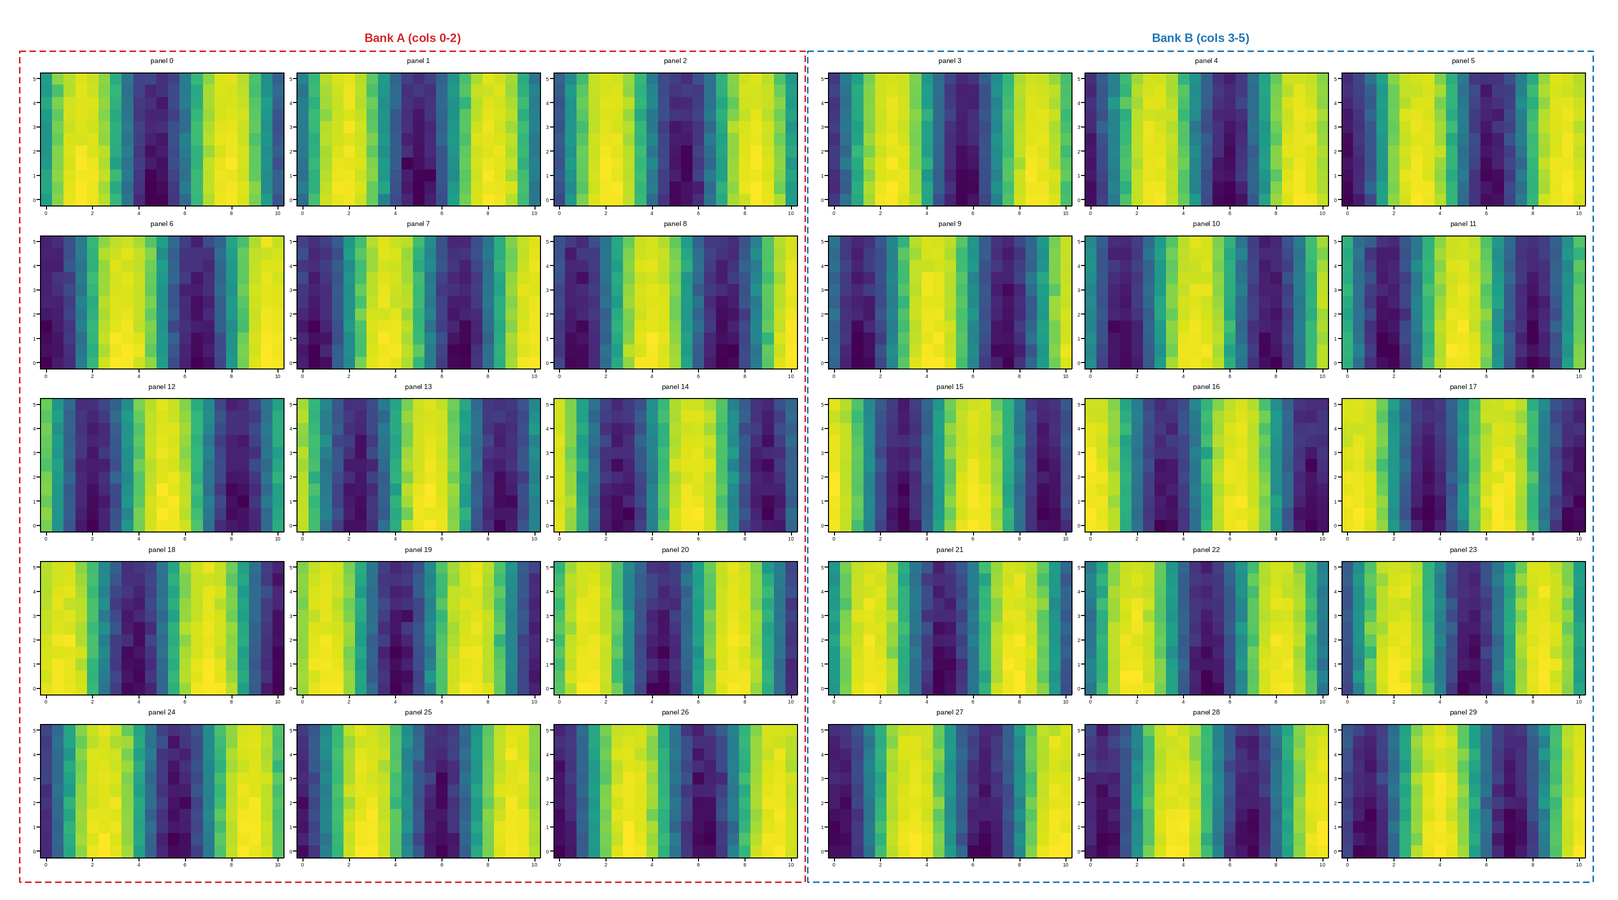
This figure has 30 panels — too many to usefully embed at a fixed size.
Open the full interactive example in a new page to pick a tool, then zoom, pan, point-pick or annotate any panel.
View this figure’s Vega export ↗ — the raw JSON spec, rendered live by a real Vega engine.
View this figure’s Vega-Lite export ↗ — the raw JSON spec(s), rendered live by a real Vega-Lite engine.
import numpy as np
import plotpress

rng = np.random.default_rng(0)
nrows, ncols = 5, 6
x = np.linspace(0, 10, 21)
y = np.linspace(0, 5, 11)
X, Y = np.meshgrid(x, y)

fig, axes = plotpress.subplots(nrows, ncols, figsize=(16, 9))
for i, ax in enumerate(axes.ravel()):
    Z = np.sin(X - 0.3 * i) * np.exp(-0.05 * Y) + 0.05 * rng.standard_normal(X.shape)
    ax.pcolormesh(x, y, Z, cmap="viridis", vmin=-1, vmax=1)
    ax.set_title(f"panel {i}", fontsize=7)
    ax.tick_params(labelsize=5)

fig.group("Bank A (cols 0-2)", list(axes[:, 0:3].ravel()),
         color="#d62728", linestyle="--", title_position="top")
fig.group("Bank B (cols 3-5)", list(axes[:, 3:6].ravel()),
         color="#1f77b4", linestyle="--", title_position="top")
fig.group_spacing(wspace=18.0)
fig.tight_layout()
Total running time of the script: (0 minutes 0.754 seconds)