Note
Go to the end to download the full example code.
Many small groups: pairing adjacent columns
The transpose of the previous “pairing every other row” example: a 4x6
grid of pcolormesh panels (24 total), split into twelve small
two-panel groups pairing each column with the one next to it: columns
0/1, 2/3, and 4/5.
title_position="top" still reads naturally for a group of columns, not
just a group of rows – and is far more forgiving of how tightly the
groups are packed than "left"/"right" would be here: a top title
only needs vertical room (a font height) above its own box, the same
small amount every group needs regardless of how many sit side by side,
where a left/right title’s width grows with the title text itself and
competes for space with its horizontal neighbors at this density.
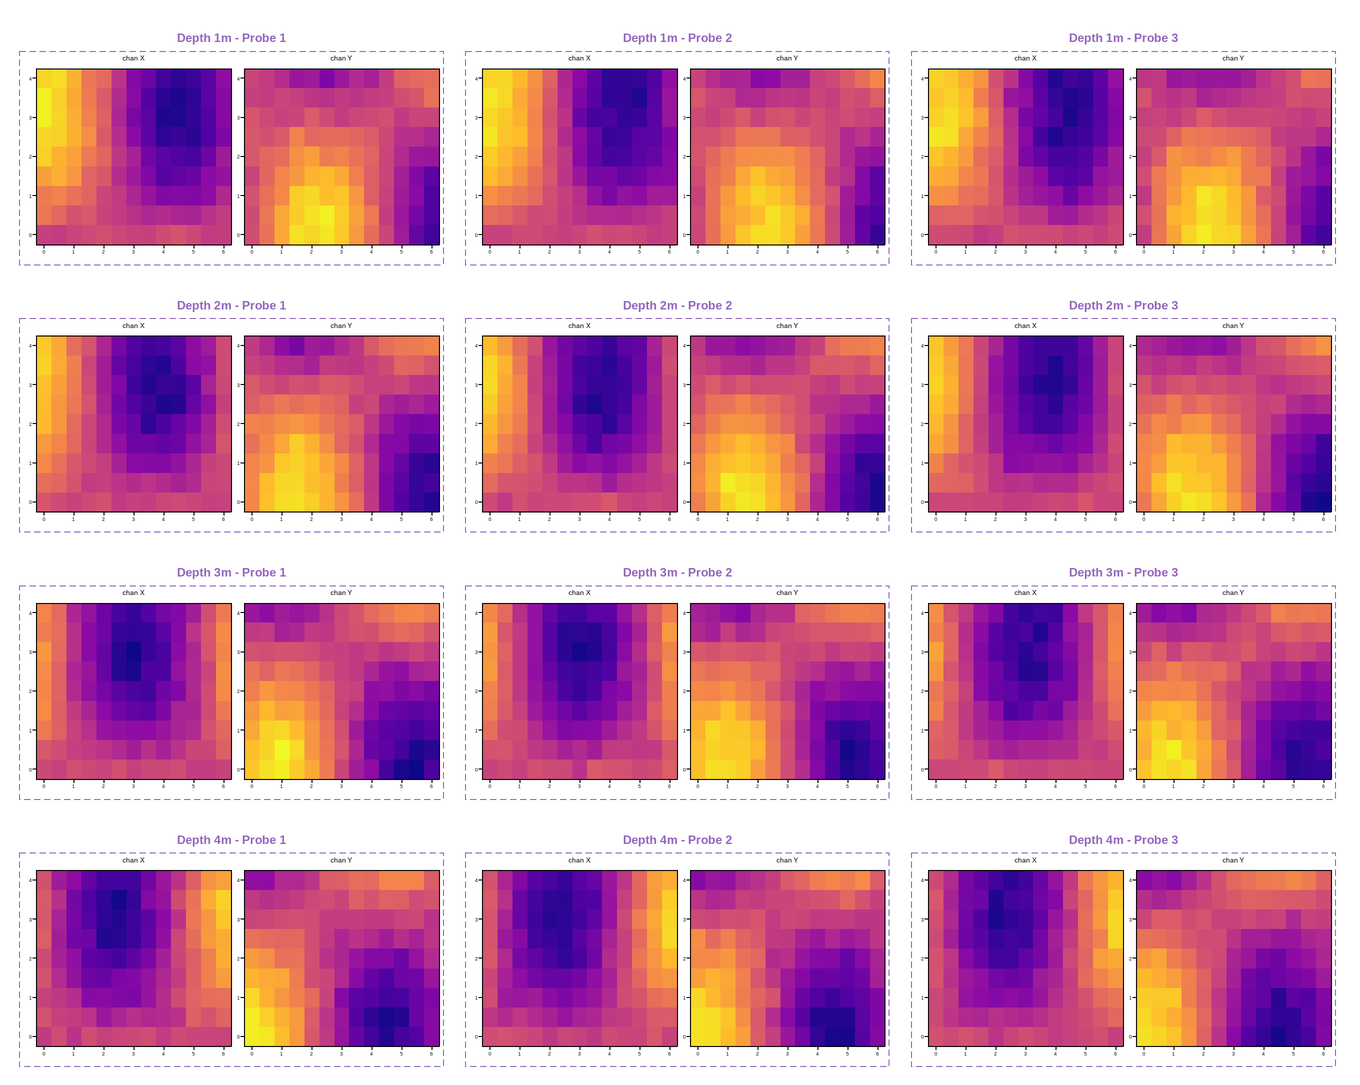
This figure has 24 panels — too many to usefully embed at a fixed size.
Open the full interactive example in a new page to pick a tool, then zoom, pan, point-pick or annotate any panel.
View this figure’s Vega export ↗ — the raw JSON spec, rendered live by a real Vega engine.
View this figure’s Vega-Lite export ↗ — the raw JSON spec(s), rendered live by a real Vega-Lite engine.
import numpy as np
import plotpress

rng = np.random.default_rng(5)
nrows, ncols = 4, 6
n_depths, n_probes = nrows, ncols // 2
x = np.linspace(0, 6, 13)
y = np.linspace(0, 4, 9)
X, Y = np.meshgrid(x, y)

fig, axes = plotpress.subplots(nrows, ncols, figsize=(13, 9))

for depth in range(n_depths):
    phase = 0.5 * depth
    for probe in range(n_probes):
        ax_x, ax_y = axes[depth, probe * 2], axes[depth, probe * 2 + 1]
        chan_x = np.cos(X * 0.7 + phase) * np.sin(Y * 0.5) + 0.06 * rng.standard_normal(X.shape)
        chan_y = np.sin(X * 0.7 + phase) * np.cos(Y * 0.5) + 0.06 * rng.standard_normal(X.shape)
        ax_x.pcolormesh(x, y, chan_x, cmap="plasma", vmin=-1.1, vmax=1.1)
        ax_y.pcolormesh(x, y, chan_y, cmap="plasma", vmin=-1.1, vmax=1.1)
        ax_x.set_title("chan X", fontsize=7)
        ax_y.set_title("chan Y", fontsize=7)
        ax_x.tick_params(labelsize=5)
        ax_y.tick_params(labelsize=5)
        fig.group(f"Depth {depth + 1}m - Probe {probe + 1}", [ax_x, ax_y],
                 title_position="top", pad=4.0, linewidth=1.0, color="#9467bd")

fig.group_spacing(wspace=30.0, hspace=36.0)
fig.tight_layout()
Total running time of the script: (0 minutes 0.673 seconds)