Note
Go to the end to download the full example code.
All four title positions at once
A 2x2 arrangement of four 2x2 quadrants, each its own group – built with
GroupLayout instead of hand-slicing a flat 4x4
grid (axes[0:2, 0:2] and friends): describe each quadrant’s own shape
once, and subplots_from_groups() works out the
combined grid and every axes’ real position itself. Each quadrant uses the
one title_position that actually faces an outer edge from where it sits:
top-left (“top”), top-right (“right”), bottom-left (“left”), bottom-right
(“bottom”). All four reach a true edge of the figure, so tight_layout()
reserves outer margin for every one of them automatically – including a
left/right title’s own rendered width, not just a top/bottom title’s
height.
That reservation only ever applies to the figure’s own outer edges,
though: the boundary between the top two quadrants and the bottom two is
an interior row gap, and the one between the left two and right two is
an interior column gap – neither is faced by any of the four groups’
titles, so nothing widens either one for them automatically. Left at their
defaults, the top pair’s box and the bottom pair’s box would collide at
the row seam, and likewise left/right at the column seam.
group_spacing(wspace=..., hspace=...) gives every box room on every
side, interior boundaries included, without discarding the outer-edge
margins tight_layout() already reserved for all four titles above.
Finding a quadrant again afterward by its outer position is one piece of
a larger lookup API – see Finding a group or axes again: title, id, or position
for the rest of it (by title, by id, many=True) in one place.
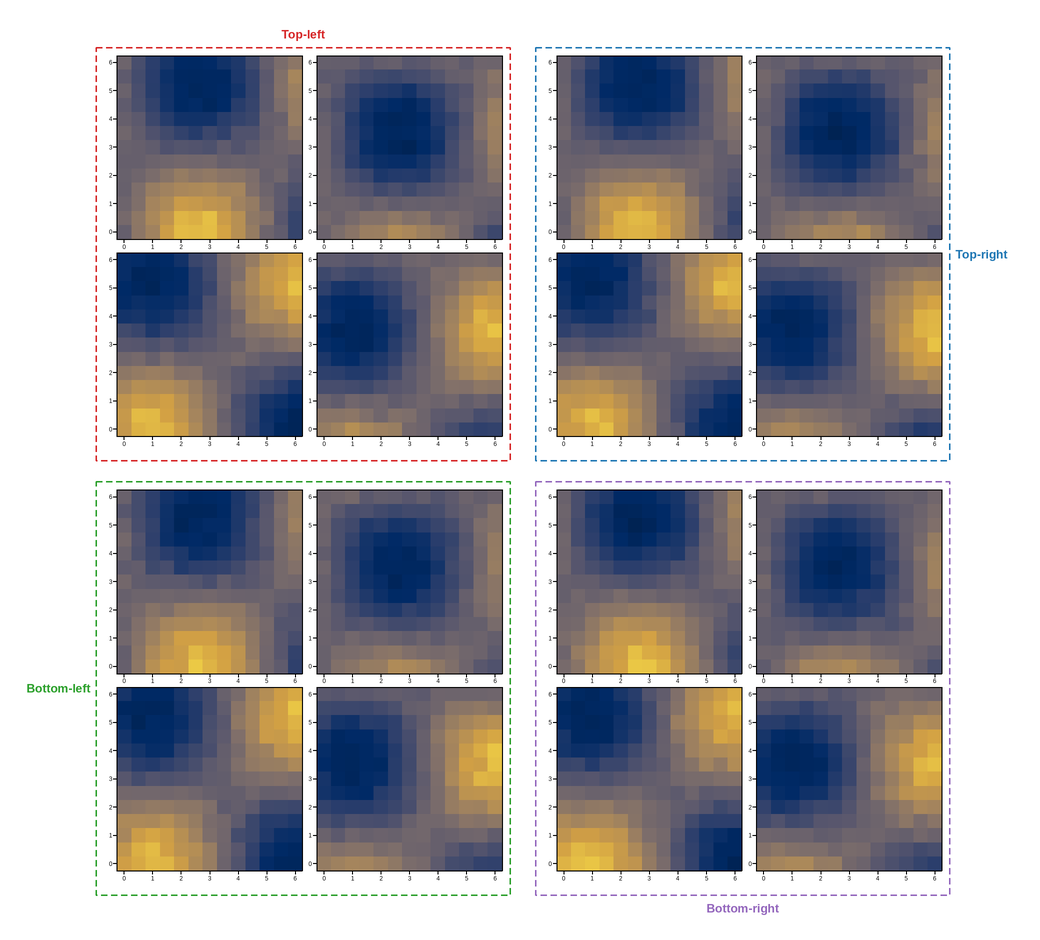
This figure has 16 panels — too many to usefully embed at a fixed size.
Open the full interactive example in a new page to pick a tool, then zoom, pan, point-pick or annotate any panel.
View this figure’s Vega export ↗ — the raw JSON spec, rendered live by a real Vega engine.
View this figure’s Vega-Lite export ↗ — the raw JSON spec(s), rendered live by a real Vega-Lite engine.
bottom-right quadrant's own title: Bottom-right
import numpy as np
import plotpress

rng = np.random.default_rng(9)
x = np.linspace(0, 6, 13)
y = np.linspace(0, 6, 13)
X, Y = np.meshgrid(x, y)

layout = plotpress.GroupLayout(2, 2)
layout.add_group(0, 0, 2, 2, title="Top-left", title_position="top", color="#d62728")
layout.add_group(0, 1, 2, 2, title="Top-right", title_position="right", color="#1f77b4")
layout.add_group(1, 0, 2, 2, title="Bottom-left", title_position="left", color="#2ca02c")
layout.add_group(1, 1, 2, 2, title="Bottom-right", title_position="bottom", color="#9467bd")

fig, axes = plotpress.subplots_from_groups(layout, figsize=(10, 9))
for outer_r in range(2):
    for outer_c in range(2):
        for r in range(2):
            for c in range(2):
                ax = axes[outer_r, outer_c][r, c]
                Z = (np.sin(X * 0.6 + r) * np.cos(Y * 0.6 + c)
                     + 0.05 * rng.standard_normal(X.shape))
                ax.pcolormesh(x, y, Z, cmap="cividis", vmin=-1.2, vmax=1.2)
                ax.tick_params(labelsize=6)

fig.group_spacing(wspace=40.0, hspace=40.0)
fig.tight_layout()

# Find a group by its outer (row, col) in the layout -- not by remembering
# which of the four it happened to be titled, or hand-slicing axes[2:4,
# 2:4] the way it would look without GroupLayout at all.
bottom_right = fig.get_group(row=1, col=1)
print("bottom-right quadrant's own title:", bottom_right.title)
Total running time of the script: (0 minutes 0.441 seconds)