Note
Go to the end to download the full example code.
Nested groups
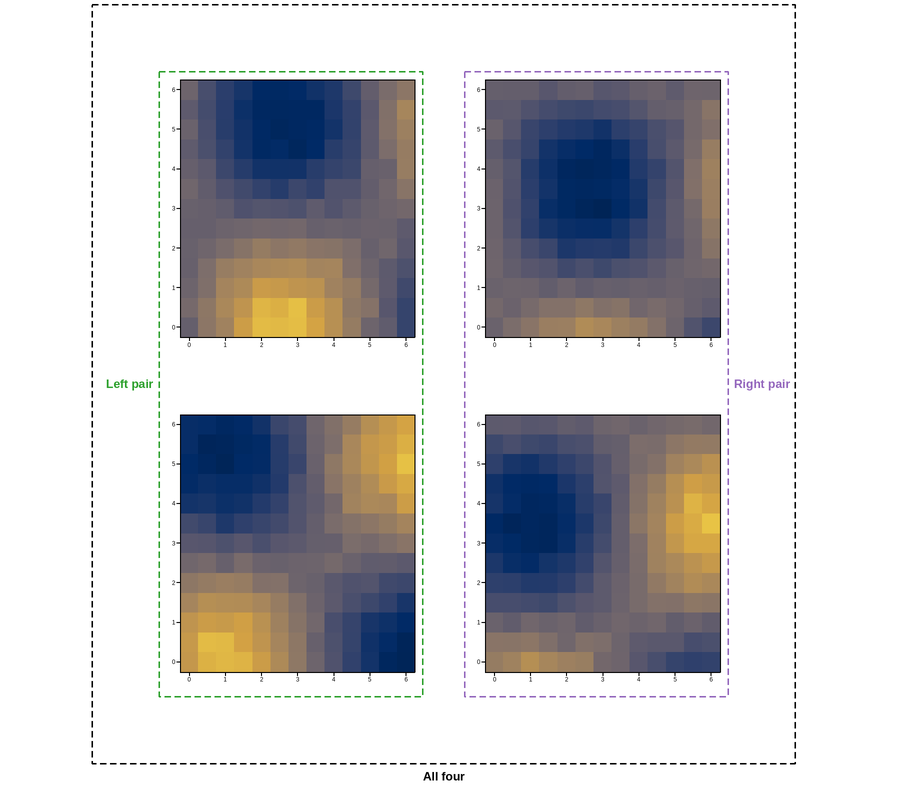
fig.group() has no notion of nesting or hierarchy – it always draws one
box, sized to the bounding rectangle of whichever axes it was given. This
figure looks nested (an outer “All four” box visually containing two
narrower ones, titles included) purely because that is what its own box
happens to bound: within a plain 2x2 grid, Left pair/Right pair
each group one 2x1 column, and All four separately groups all four
axes. All three are otherwise completely independent, unrelated groups as
far as plotpress is concerned – nothing links All four to the two
narrower ones, or stops you from moving one axes out of a “child” group
without touching the “parent” at all.
Two choices make every title land inside the outer box rather than alongside or past it:
Left pair/Right pairtake the one edge each actually reaches that the other doesn’t (left/right);All fourtakesbottom, the one edge neither of them uses –tight_layout()reserves title space per edge, not per group, so distinct edges avoid two titles fighting over one reservation.Margins are set by hand with
subplots_adjust()instead oftight_layout().All four’s ownpadhas to be wide enough to clearLeft pair’s andRight pair’s titles, not just their axes – roomtight_layout()never reserves on its own, since neither of those titles faces a figure edge it knows to budget for. Generous, explicit margins on every side give that pad somewhere to expand into without running off the canvas.
Live figure — pick a tool, then zoom, pan, point-pick or annotate. Nothing is active until a tool is selected.
View this figure’s Vega export ↗ — the raw JSON spec, rendered live by a real Vega engine.
View this figure’s Vega-Lite export ↗ — the raw JSON spec(s), rendered live by a real Vega-Lite engine.
import numpy as np
import plotpress

rng = np.random.default_rng(9)
x = np.linspace(0, 6, 13)
y = np.linspace(0, 6, 13)
X, Y = np.meshgrid(x, y)

fig, axes = plotpress.subplots(2, 2, figsize=(9, 8))
for r in range(2):
    for c in range(2):
        Z = np.sin(X * 0.6 + r) * np.cos(Y * 0.6 + c) + 0.05 * rng.standard_normal(X.shape)
        axes[r, c].pcolormesh(x, y, Z, cmap="cividis", vmin=-1.2, vmax=1.2)
        axes[r, c].tick_params(labelsize=6)

fig.group("Left pair", [axes[0, 0], axes[1, 0]], title_position="left", color="#2ca02c")
fig.group("Right pair", [axes[0, 1], axes[1, 1]], title_position="right", color="#9467bd")
fig.group("All four", list(axes.ravel()), title_position="bottom", color="black",
         pad=75.0)
fig.subplots_adjust(left=0.20, right=0.80, top=0.90, bottom=0.16,
                    wspace=0.30, hspace=0.30)
Total running time of the script: (0 minutes 0.209 seconds)