Note
Go to the end to download the full example code.
A dashboard mixing group shapes and deleted axes
The realistic case GroupLayout is actually for: a dashboard whose
panels are genuinely different shapes, not a tidy repeated pattern. Six
groups share one GroupLayout(2, 3) outer grid – three different plain
rectangular shapes, plus one with a mask describing a checkerboard of
present/deleted cells – and subplots_from_groups()
works out the one shared grid (a least-common-multiple resolution across
every group’s own row/column count) that fits all of them as ordinary,
non-overlapping spans, with no per-group math to do by hand.
The checkerboard group (“Diagnostics”) is the strange combination: an uneven-shaped neighbor (the tall single-column “History” group) still shares one grid with it, just at whatever resolution both need – the checkerboard mask rides on top of that same shared grid rather than needing its own separate one.
Keep every group’s row count sharing a small common multiple (and
likewise for columns) – 2, 4, and 8 rather than 2, 3, and 5. The whole
figure resolves onto one grid sized to the least common multiple of
every group’s own shape, so shapes with incompatible prime factors (a
literal 5-wide group here would force a much finer shared grid than a
4-wide one) can blow that resolution up far past what a dense grid can
actually afford – see GroupLayout’s own
docstring for what happens past that point.
Dismissing “Alerts” below uses remove_group()
– see
Finding a group or axes again: title, id, or position for every way to find a
group or axes again, gathered in one place.
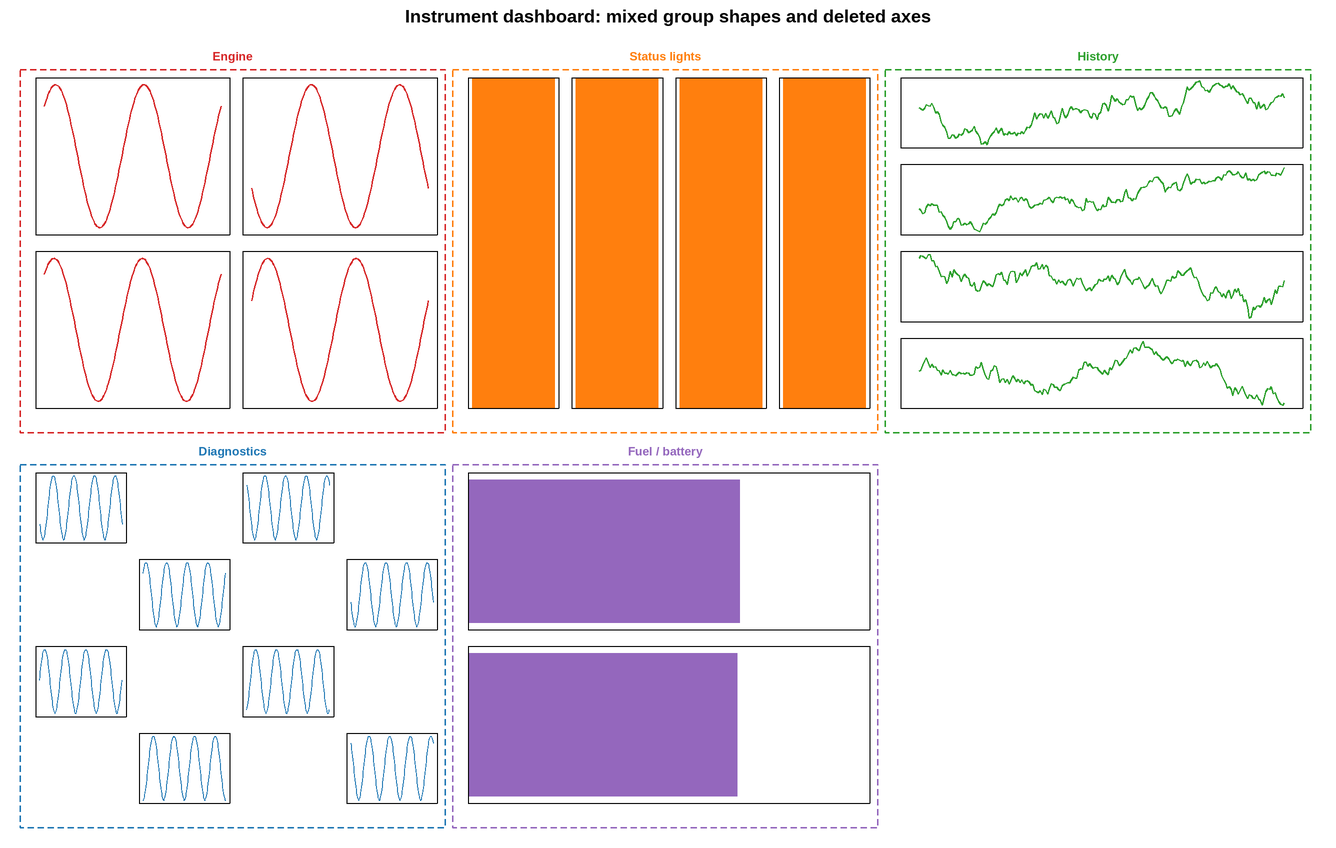
This figure has 22 panels — too many to usefully embed at a fixed size.
Open the full interactive example in a new page to pick a tool, then zoom, pan, point-pick or annotate any panel.
View this figure’s Vega export ↗ — the raw JSON spec, rendered live by a real Vega engine.
View this figure’s Vega-Lite export ↗ — the raw JSON spec(s), rendered live by a real Vega-Lite engine.
groups remaining: ['Engine', 'Status lights', 'History', 'Diagnostics', 'Fuel / battery']
import numpy as np
import plotpress

rng = np.random.default_rng(11)
t = np.linspace(0, 4 * np.pi, 200)

layout = plotpress.GroupLayout(2, 3)
layout.add_group(0, 0, 2, 2, title="Engine", color="#d62728")
layout.add_group(0, 1, 1, 4, title="Status lights", color="#ff7f0e")
layout.add_group(0, 2, 4, 1, title="History", color="#2ca02c")
layout.add_group(1, 0, 4, 4, title="Diagnostics", color="#1f77b4",
                mask=[[1, 0, 1, 0], [0, 1, 0, 1], [1, 0, 1, 0], [0, 1, 0, 1]])
layout.add_group(1, 1, 2, 1, title="Fuel / battery", color="#9467bd")
layout.add_group(1, 2, 1, 1, title="Alerts", color="#8c564b")

fig, axes = plotpress.subplots_from_groups(layout, figsize=(13, 8))

# Engine: 2x2 -- a few related trend lines.
for ax in axes[0, 0].ravel():
    ax.plot(t, np.sin(t + rng.uniform(0, 6)) * (1 + 0.2 * rng.standard_normal()),
           color="#d62728")
    ax.set_xticks([]); ax.set_yticks([])

# Status lights: 1x5 -- simple on/off indicators as bars.
for i, ax in enumerate(axes[0, 1]):
    ax.bar([0], [1 if rng.random() > 0.3 else 0.15], color="#ff7f0e", width=0.6)
    ax.set_ylim(0, 1)
    ax.set_xticks([]); ax.set_yticks([])

# History: 3x1 -- a tall stack of trend panels.
for ax in axes[0, 2]:
    ax.plot(t, np.cumsum(rng.standard_normal(t.size)) * 0.1, color="#2ca02c")
    ax.set_xticks([]); ax.set_yticks([])

# Diagnostics: 3x3 checkerboard -- only the mask's True cells exist.
for ax in axes[1, 0].ravel():
    if ax is None:
        continue
    ax.plot(t, np.sin(2 * t + rng.uniform(0, 6)), color="#1f77b4", linewidth=1.0)
    ax.set_xticks([]); ax.set_yticks([])

# Fuel / battery: 2x1.
for ax in axes[1, 1]:
    ax.barh([0], [rng.uniform(0.3, 1.0)], color="#9467bd")
    ax.set_xlim(0, 1)
    ax.set_xticks([]); ax.set_yticks([])

# Alerts: a single panel.
axes[1, 2].pie([3, 1], colors=["#8c564b", "#ecd9d0"])

fig.group_spacing(wspace=18.0, hspace=22.0)
fig.suptitle("Instrument dashboard: mixed group shapes and deleted axes")
fig.tight_layout()

# An acknowledged alert dismisses its whole panel -- fig.remove_group()
# removes the group's axes (via the now id/group-aware Axes.remove()) and
# its own box/title registration together, leaving a blank rectangle
# rather than reflowing the rest of the dashboard to fill it (the same
# thing Axes.remove() already does for one axes).
fig.remove_group(title="Alerts")
print("groups remaining:", [g.title for g in fig.get_groups()])
Total running time of the script: (0 minutes 0.369 seconds)