Grouping axes
fig.group() draws a labeled box around a set of axes – a cluster of
related panels in a larger grid, or a single one worth calling out –
without a separate figure or a caption pointing back to it. The box clears
each axes’ own tick labels, axis labels, and title, not just its bare plot
rect; tight_layout() reserves margin for a group whose title faces the
grid’s own outer edge, the same way it already does for a
suptitle/colorbar/figure legend. fig.group_spacing() reserves extra
room between subplots for group boxes at interior boundaries, where no
title faces the boundary and nothing widens it automatically otherwise –
without discarding tight_layout()’s own margins the way
subplots_adjust() would.
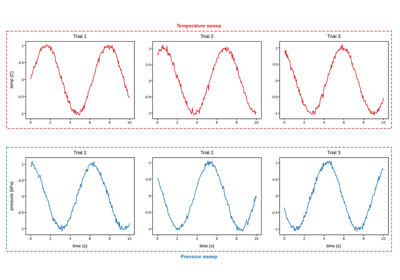
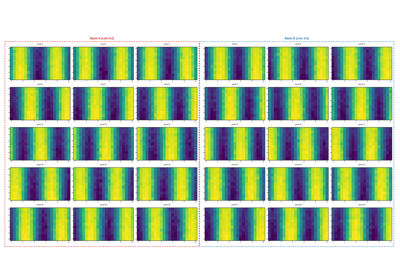
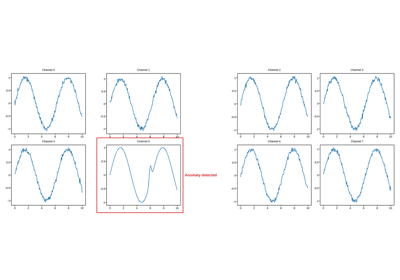
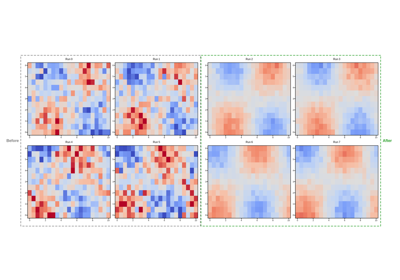
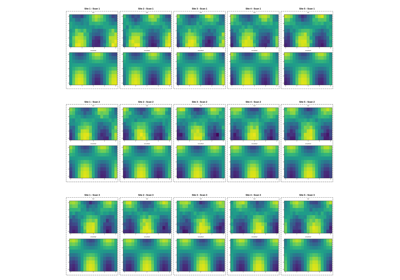
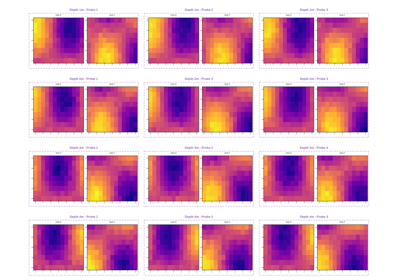
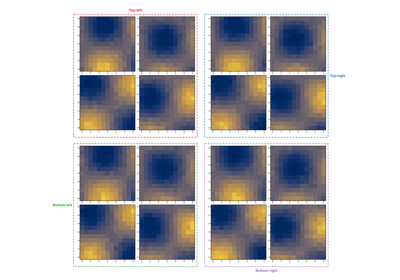
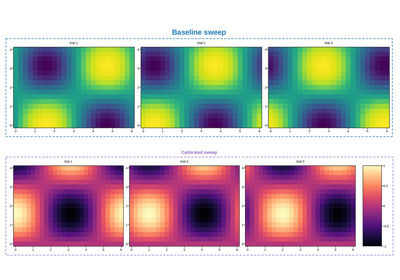
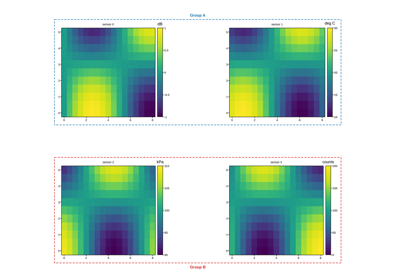
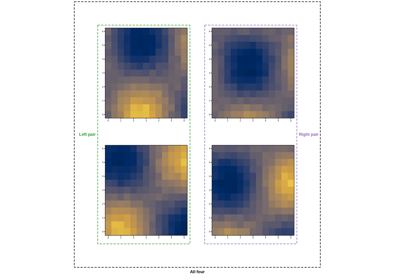
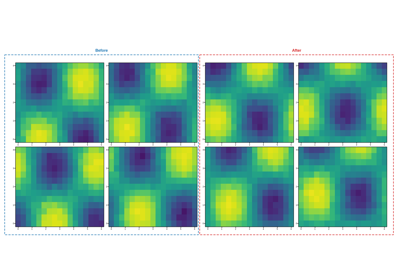
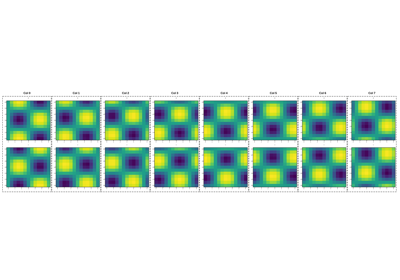
Many groups sharing one outer edge share one margin
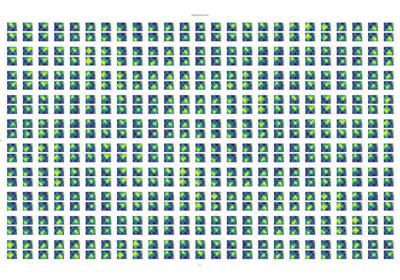
500 panels, 250 groups, each with its own colorbar
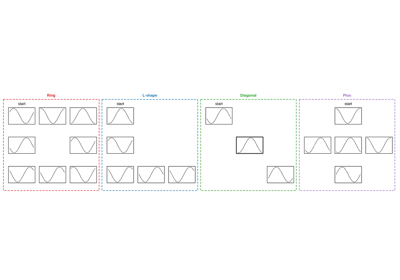
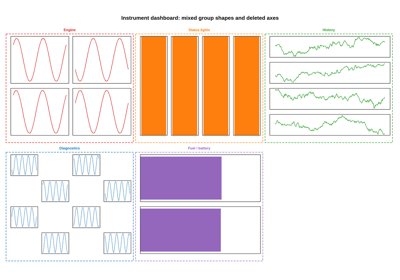
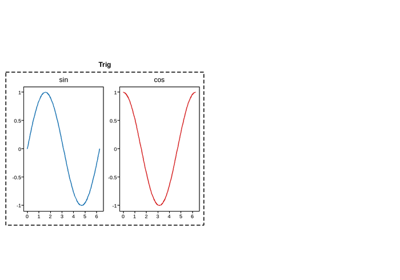
Mosaic titles, planning a layout ahead, and an ordinary grid’s own lookup
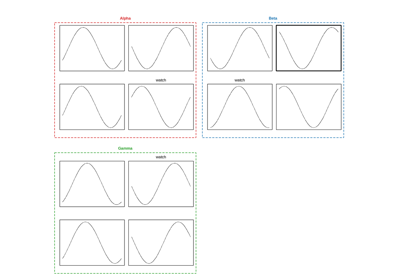
Finding a group or axes again: title, id, or position
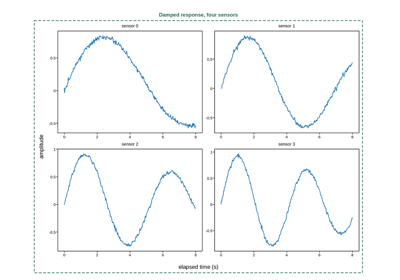
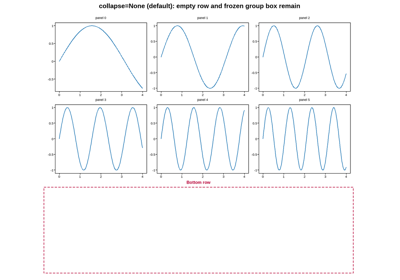
Reclaiming whitespace after removing axes and groups