Note
Go to the end to download the full example code.
Finding a group or axes again: title, id, or position
Every way this gallery uses to reach a group or an axes again after building a figure, gathered in one place as its own dedicated subject rather than a coda to some other example.
fig.get_group(row=, col=, title=, id=), fig.get_ax(row=, col=,
title=, id=), and group.get_ax(row=, col=, title=, id=) all
resolve exactly one of those four keys (row/col count as one
paired key). The two get_ax methods differ only in whose axes get
searched: get_ax() looks across the
whole figure and its row=/col= means a plain axes’ own position
in an ordinary grid; get_ax() looks only
inside one group and its row=/col= means that axes’ position
within the group.
A group or an axes gets a name two ways. A title is drawn text
(group()’s title=,
set_title()) that may legitimately repeat –
several panels can all say “residual”. An id
(set_id()/get_id(),
group()’s own id=) is a plain, undrawn identifier that must stay
unique across the whole figure – reusing one raises immediately rather
than silently attaching two things to the same identity.
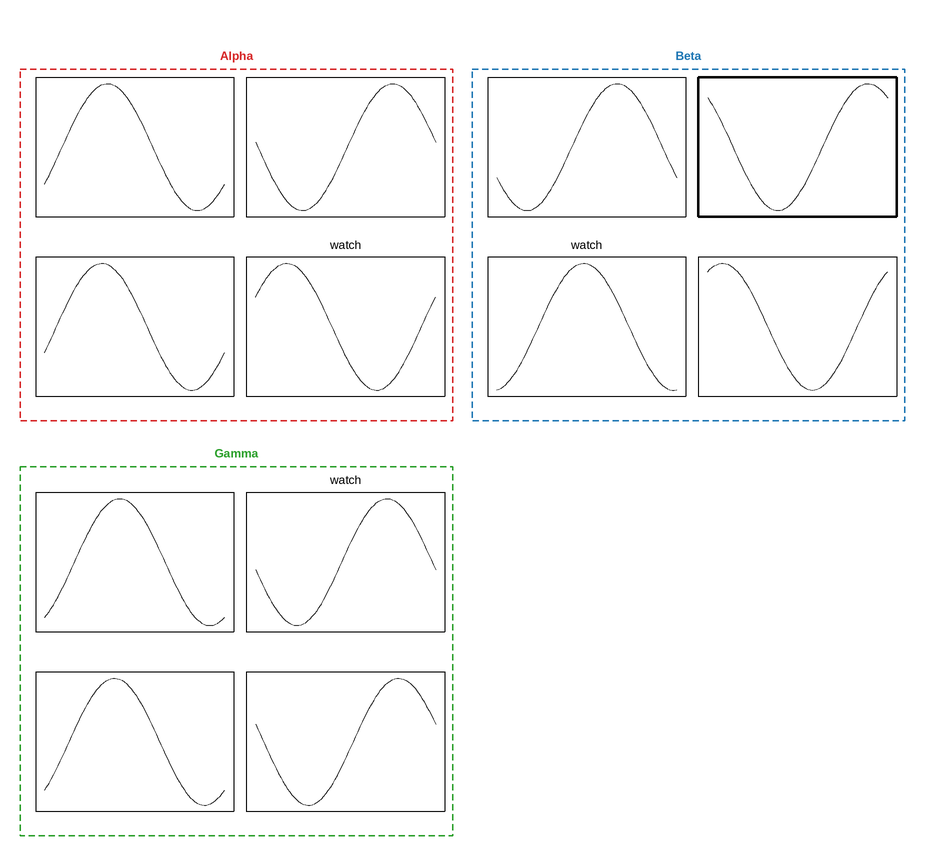
This figure has 12 panels — too many to usefully embed at a fixed size.
Open the full interactive example in a new page to pick a tool, then zoom, pan, point-pick or annotate any panel.
View this figure’s Vega export ↗ — the raw JSON spec, rendered live by a real Vega engine.
View this figure’s Vega-Lite export ↗ — the raw JSON spec(s), rendered live by a real Vega-Lite engine.
highlighted axes' own id: beta-01
as expected, a duplicate id raises: 'beta-01' is already used by another axes in this figure
4 axes titled 'watch', one per group
as expected, a removed group can no longer be found: get_group(): no group matches id='delta'
import numpy as np
import plotpress

layout = plotpress.GroupLayout(2, 2)
layout.add_group(0, 0, 2, 2, title="Alpha", id="alpha", color="#d62728",
                 axes_ids=[["alpha-00", "alpha-01"], ["alpha-10", "alpha-11"]])
layout.add_group(0, 1, 2, 2, title="Beta", id="beta", color="#1f77b4",
                 axes_ids=[["beta-00", "beta-01"], ["beta-10", "beta-11"]])
layout.add_group(1, 0, 2, 2, title="Gamma", id="gamma", color="#2ca02c",
                 axes_ids=[["gamma-00", "gamma-01"], ["gamma-10", "gamma-11"]])
layout.add_group(1, 1, 2, 2, title="Delta", id="delta", color="#9467bd",
                 axes_ids=[["delta-00", "delta-01"], ["delta-10", "delta-11"]])

fig, axes = plotpress.subplots_from_groups(layout, figsize=(9, 8))
rng = np.random.default_rng(4)
x = np.linspace(0, 2 * np.pi, 80)
for outer in axes.ravel():
    for ax in outer.ravel():
        ax.plot(x, np.sin(x + rng.uniform(0, 6)), color="#333333", linewidth=1.1)
        ax.set_xticks([])
        ax.set_yticks([])

fig.group_spacing(wspace=30.0, hspace=30.0)
fig.tight_layout()

# -- a group by its outer (row, col) in the layout --------------------------
gamma = fig.get_group(row=1, col=0)
assert gamma.title == "Gamma"

# -- a group by its own id, set once at add_group() time --------------------
beta = fig.get_group(id="beta")

# -- an axes within a group, by its inner (row, col) position ---------------
beta_top_right = beta.get_ax(row=0, col=1)

# -- the same axes, straight from the figure by the id axes_ids gave it at
# construction time -- no group lookup step needed at all -------------------
assert fig.get_ax(id="beta-01") is beta_top_right
for side in beta_top_right.spines:
    beta_top_right.spines[side].set_color("black")
    beta_top_right.spines[side].set_linewidth(2.5)

# -- an id round-trips through get_id() --------------------------------------
print("highlighted axes' own id:", beta_top_right.get_id())

# -- ids are unique per figure: reusing one raises rather than silently
# attaching two axes to the same identity ------------------------------------
try:
    gamma.get_ax(row=0, col=0).set_id("beta-01")
except ValueError as exc:
    print("as expected, a duplicate id raises:", exc)

# -- titles, unlike ids, may legitimately repeat -- tag one axes per group
# with a shared title and collect all four at once with many=True -----------
tag_cell = {"alpha": (1, 1), "beta": (1, 0), "gamma": (0, 1), "delta": (0, 0)}
for group_id, (r, c) in tag_cell.items():
    fig.get_group(id=group_id).get_ax(row=r, col=c).set_title("watch")

watched = fig.get_ax(title="watch", many=True)
print(f"{len(watched)} axes titled 'watch', one per group")

# -- dropping a group (and every one of its axes) once it's no longer
# wanted -- fig.get_group()/get_ax() can no longer find anything that was
# only reachable through it ---------------------------------------------------
fig.remove_group(title="Delta")
try:
    fig.get_group(id="delta")
except ValueError as exc:
    print("as expected, a removed group can no longer be found:", exc)
Total running time of the script: (0 minutes 0.216 seconds)