Note
Go to the end to download the full example code.
Hidden axis labels (stored, not drawn)
set_xlabel("...", visible=False) / set_ylabel(..., visible=False)
– or set_xlabel_visible(False) / set_ylabel_visible(False) to
toggle without retyping the text – store an axis label without drawing
it and without reserving any margin for it. get_xlabel() still
returns the text, ax.print_summary() still lists it (marked
(hidden)), the load_data() layout round-trip still carries it,
and a picked point’s Extract record in the interactive HTML still
reports it (see Interactive figures for what an Extract
record contains).
The use for it: a dense grid where a per-panel label on every axes would
be clutter, so the figure shows one shared
supxlabel()/
supylabel() instead – but each panel’s
axes should still know what its x and y mean, for anyone who later
pulls the data back out. See
Hidden per-panel labels survive the round trip (and the Extract)
for that payoff, with a worked Extract record.
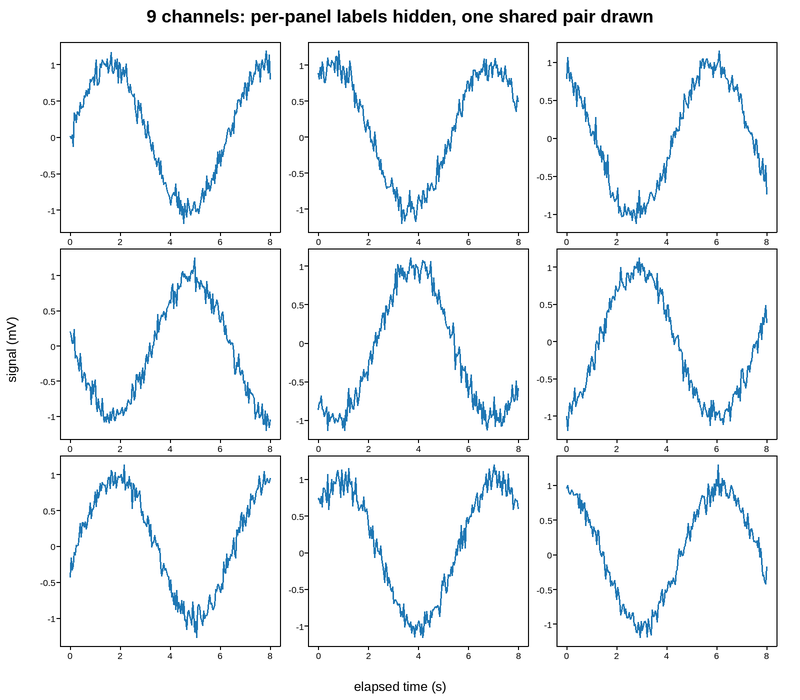
This figure has 9 panels — too many to usefully embed at a fixed size.
Open the full interactive example in a new page to pick a tool, then zoom, pan, point-pick or annotate any panel.
View this figure’s Vega export ↗ — the raw JSON spec, rendered live by a real Vega engine.
View this figure’s Vega-Lite export ↗ — the raw JSON spec(s), rendered live by a real Vega-Lite engine.
get_xlabel() still returns: 'elapsed time (s)'
get_xlabel_visible(): False
Axes 8:
  position:  row 2, col 2 of a 3x3 grid
  visible:   True
  x:  linear, [-0.4, 8.4]
  y:  linear, [-1.314, 1.43]
  artists:   1 Line2D
  labels:    xlabel='elapsed time (s)' (hidden) ylabel='signal (mV)' (hidden)
  to_vega():      OK
  to_vega_lite(): OK
import numpy as np
import plotpress

rng = np.random.default_rng(2)
t = np.linspace(0, 8, 200)

fig, axes = plotpress.subplots(3, 3, figsize=(8, 7))
for i, ax in enumerate(axes.ravel()):
    ax.plot(t, np.sin(t + i) + 0.1 * rng.standard_normal(t.size))
    # Every panel names its own axes -- but hidden, so the grid stays clean
    # and only the shared labels below are actually drawn.
    ax.set_xlabel("elapsed time (s)", visible=False)
    ax.set_ylabel("signal (mV)", visible=False)

fig.supxlabel("elapsed time (s)")
fig.supylabel("signal (mV)")
fig.suptitle("9 channels: per-panel labels hidden, one shared pair drawn")
fig.tight_layout()

# The text is still there -- just not painted.
mid = axes[1, 1]
print("get_xlabel() still returns:", repr(mid.get_xlabel()))
print("get_xlabel_visible():", mid.get_xlabel_visible())

# set_xlabel_visible() / set_ylabel_visible() flip the state without
# retyping the label -- toggle one on to inspect it, then back off.
mid.set_xlabel_visible(True)
assert mid.get_xlabel_visible() is True
mid.set_xlabel_visible(False)
assert not mid.get_xlabel_visible() and mid.get_xlabel() == "elapsed time (s)"

# print_summary() marks a hidden label so it's obvious which panels carry
# one that isn't on the canvas.
axes[2, 2].print_summary()
Total running time of the script: (0 minutes 0.214 seconds)