Reloading data from a saved HTML
plotpress.load_data() reads the plotted data straight back out of a
saved interactive HTML file – no need for the original Python objects
that built it to still be around. These examples round-trip through it:
reload a figure’s data, transform it, and rebuild a new figure in a
similar layout.
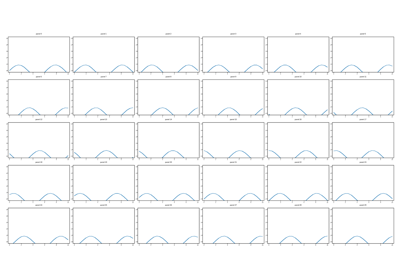
Reload a mesh grid and replot one slice per panel as a line
Reload a mesh grid and replot one slice per panel as a line
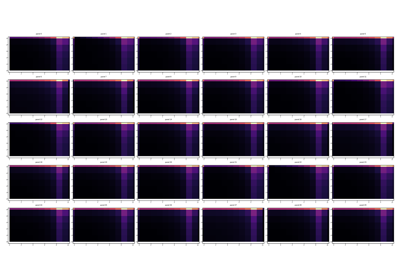
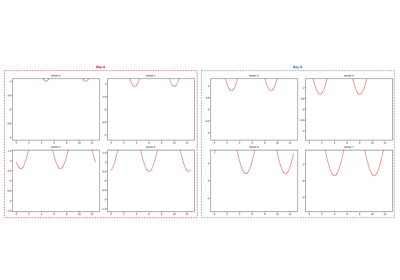
Reload a grouped dashboard, preserving its group boxes
Reload a grouped dashboard, preserving its group boxes
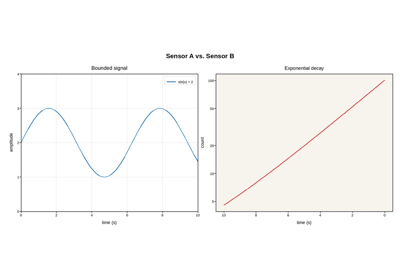
Reload a figure’s titles, labels, and axis settings, not just its data
Reload a figure's titles, labels, and axis settings, not just its data
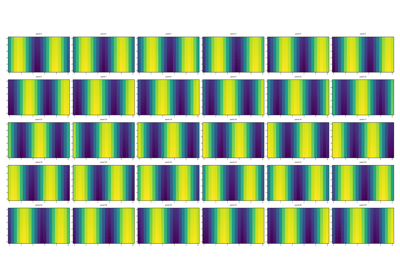
Reload a mesh grid as one labeled xarray.Dataset, analyze, and replot
Reload a mesh grid as one labeled xarray.Dataset, analyze, and replot
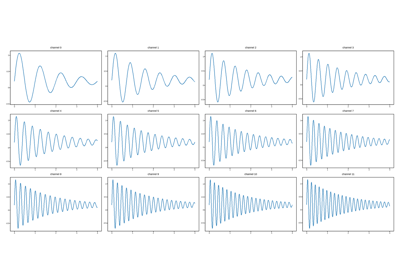
Reload a grid of line traces as one labeled xarray.Dataset, analyze, and replot
Reload a grid of line traces as one labeled xarray.Dataset, analyze, and replot
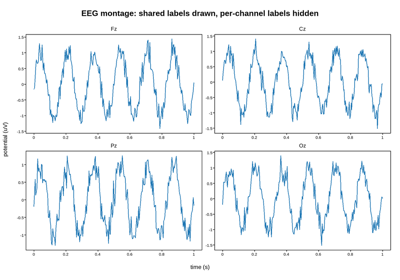
Hidden per-panel labels survive the round trip (and the Extract)
Hidden per-panel labels survive the round trip (and the Extract)