Seaborn-style distribution plots

Distribution plots in the style of seaborn’s example gallery, drawn with plotpress’s own methods – kdeplot, ecdfplot, rugplot and the inner/cut options on violinplot. These take plain arrays rather than a tidy dataframe, so there is no pandas or seaborn dependency; the semantic-mapping API (hue=, FacetGrid) is deliberately not replicated.
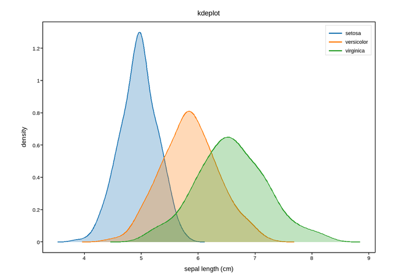
Overlapping densities

Overlapping densities

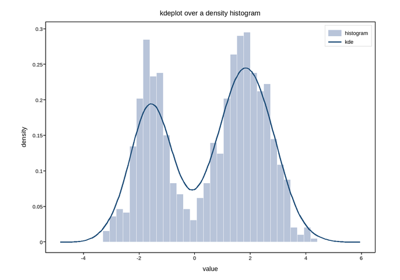
Density over a histogram

Density over a histogram

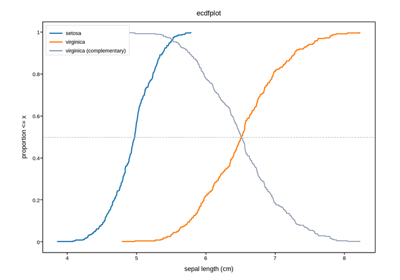
Empirical cumulative distribution

Empirical cumulative distribution

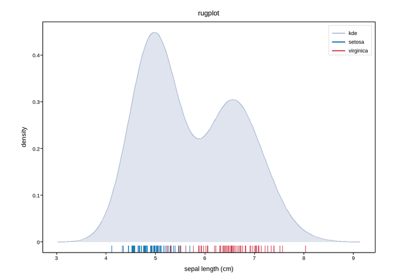
Rug of raw observations

Rug of raw observations

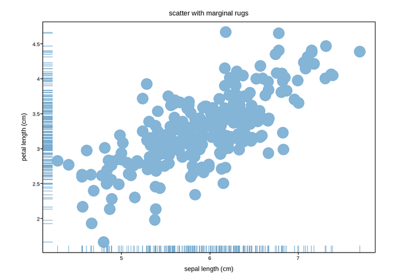
Marginal rugs on a scatter

Marginal rugs on a scatter

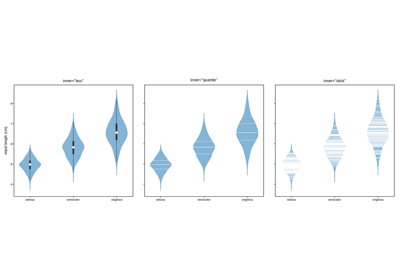
Violin inner annotations

Violin inner annotations

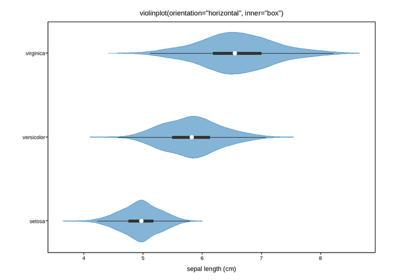
Horizontal violins

Horizontal violins

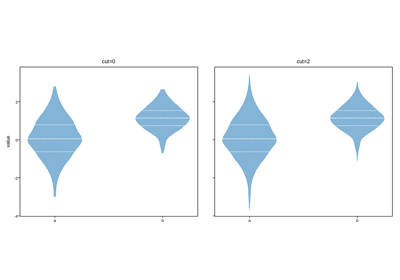
Density tails and the cut parameter

Density tails and the cut parameter